Adding and tuning indicators
How to add an indicator from the panel, change its settings and lines, hide, reorder or remove it, and where each group of indicators belongs.
An indicator is a calculation drawn from the candles: a moving average over the price, an oscillator in its own pane, volume as columns. MillionChart has more than a hundred built in and four MillionAlgo studies. This page is about the mechanics — adding, tuning, hiding and removing — and the groups. Each indicator has its own page in this section with what it shows, how it is calculated, how traders read it, its settings and an example on gold.
Add an indicator#
- Click Indicators in the strip (on the Pro screen the key is I; on a phone, Indicators in the bar at the bottom).
- Type a name or a short name in the search box —
ema,rsi,bb— and press Enter for the first result, or click a row. You can type inputs after the name:ema 21adds a 21-period EMA. - The panel stays open so you can add more; Esc closes it.
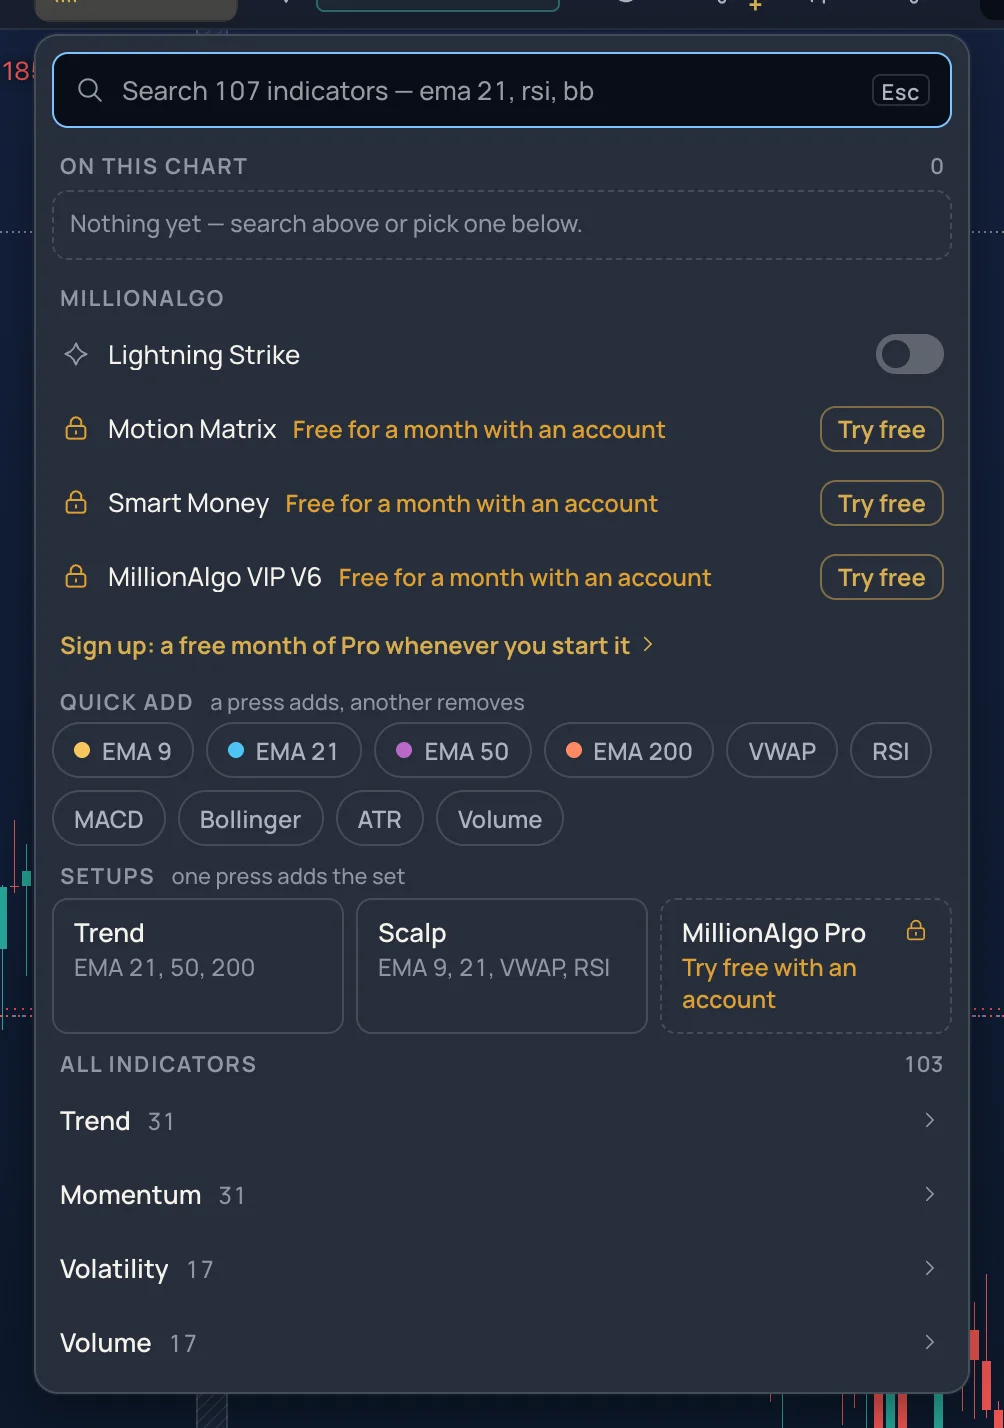
The panel has four parts:
- On this chart — every indicator on the chart, with hide, settings, duplicate and remove.
- MillionAlgo — the four house studies: Lightning Strike, Motion Matrix, Smart Money and VIP V6; see The MillionAlgo studies.
- Quick add and Setups — one press adds a common indicator with its usual settings (EMA 9 / 21 / 50 / 200, VWAP, RSI, MACD, Bollinger, ATR, Volume), or a whole set; a second press removes it.
- All indicators — the catalogue by group, with a star on each row for your favourites.
The same search works from the chart's search box: Ctrl+K, then +ema 21.
The legend chip#
Every indicator on the chart has a chip in the legend at the top left: its short name and its inputs, with the current value next to it.
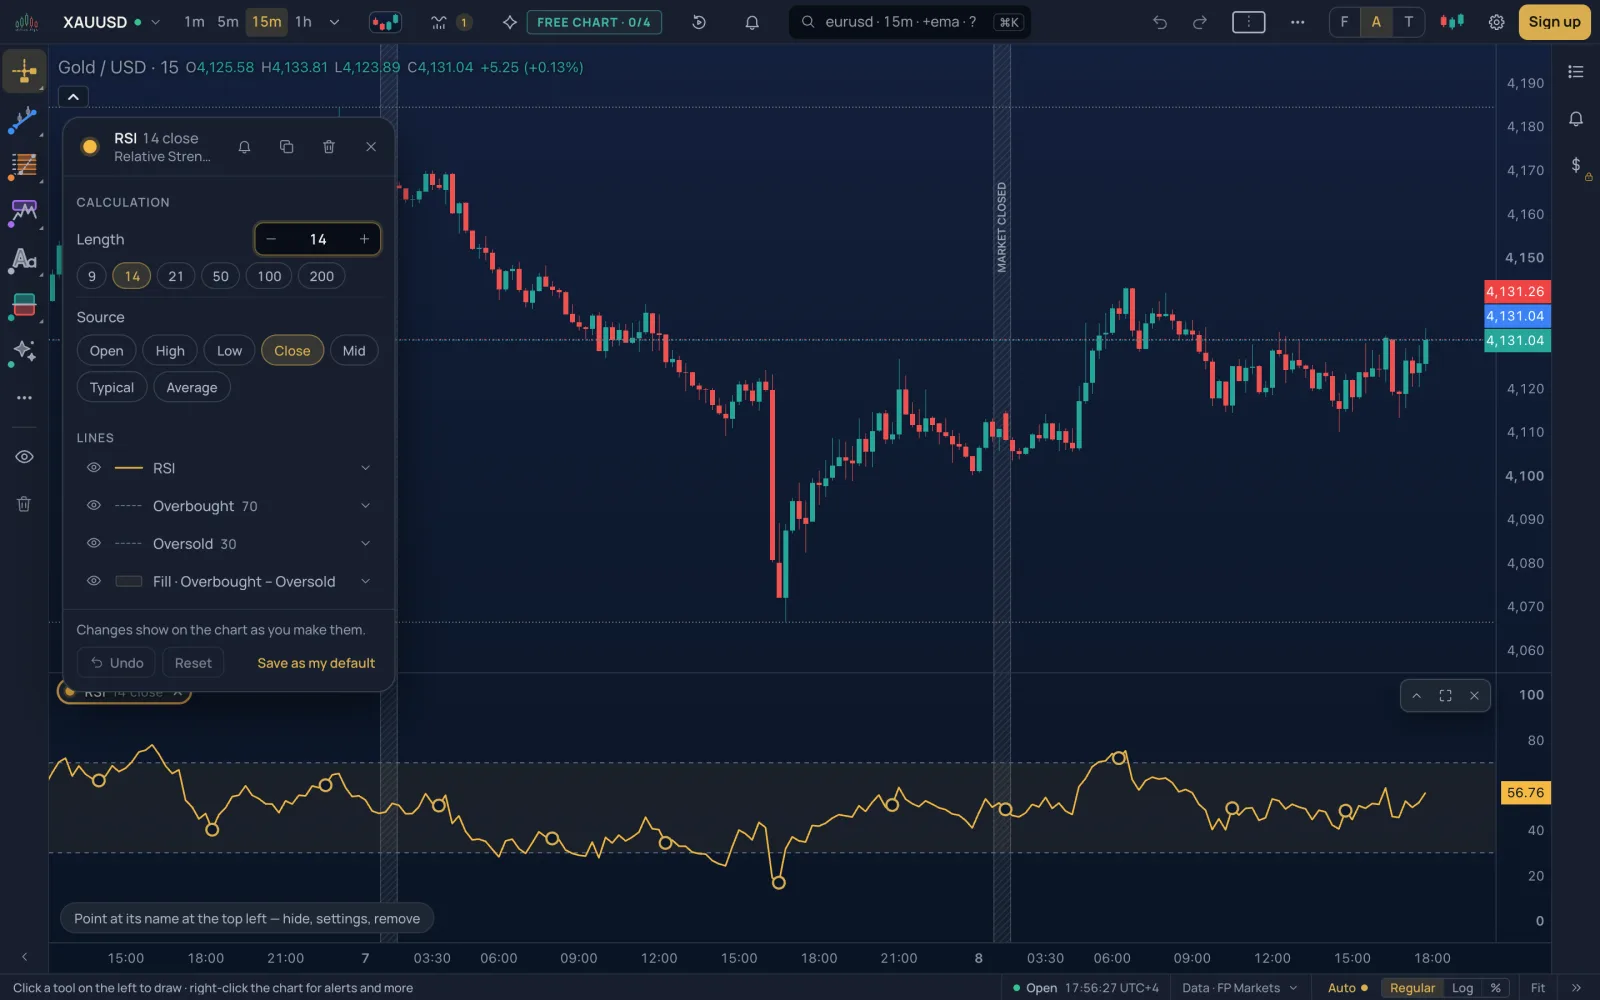
- Click the chip: its settings card opens.
- The dot in front of the chip hides and shows the indicator (the chip goes dashed while hidden).
- Drag a chip to reorder the indicators.
- × on the chip removes the indicator.
The settings card#
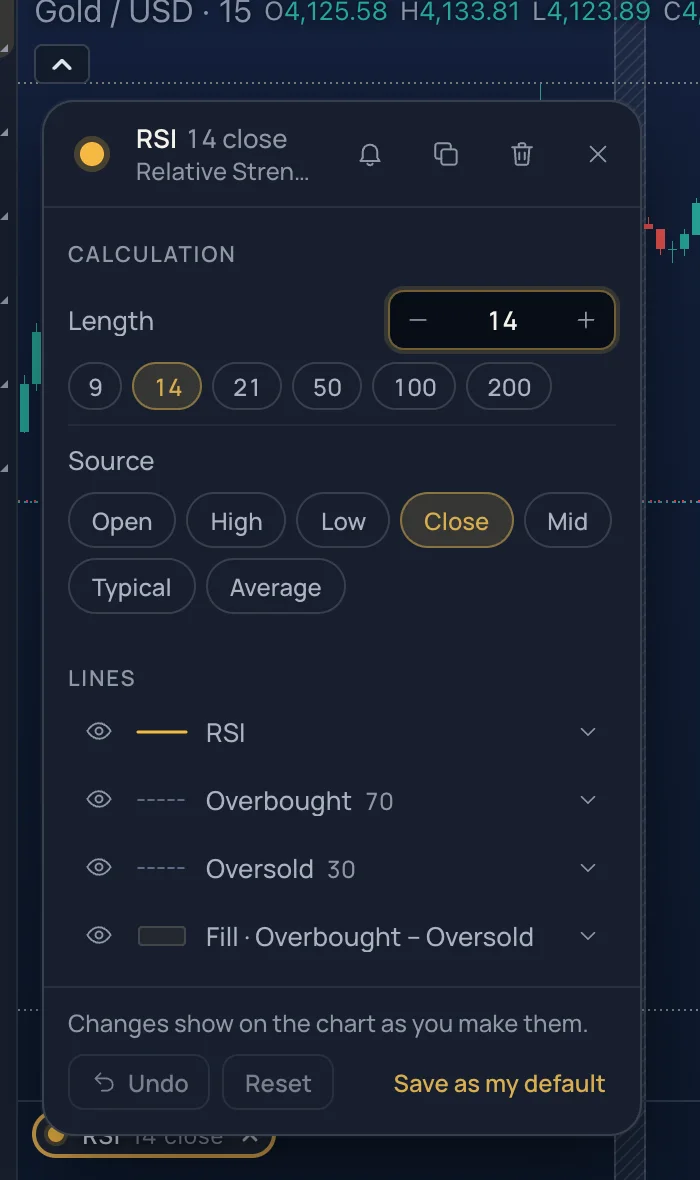
The card has two parts. Calculation holds the inputs that change the numbers: the length, the source (open, high, low, close, the averages), and whatever else the indicator takes. Lengths have presets; type any number in the box. Lines holds one row per line, band, histogram or fill the indicator draws: its colour, how it is drawn, its width and dash, and whether it is shown. Changes apply as you make them; Undo takes the last one back, Reset restores the defaults, and Save as my default makes your settings the defaults for the next time you add this indicator.
Panes#
An indicator either draws over the candles (a moving average, Bollinger Bands, VWAP) or in its own pane under the chart (RSI, MACD, volume). The page of each indicator says which. A pane can be resized by dragging the line between panes, and the buttons at its top right collapse it or remove everything in it.
Alerts on an indicator#
An alert can watch an indicator's value: crossing a level, crossing another line, entering or leaving a zone. Open the alert dialog from the Alerts list or the bell, choose the indicator as the condition, and pick what should happen. See Alerts.
The groups#
| Group | What the indicators in it do |
|---|---|
| MillionAlgo | The four house studies: signals and structure drawn by MillionAlgo's own models |
| Trend | Moving averages of every kind, trend direction and strength, stops that follow a trend |
| Momentum | Oscillators: the speed of price, overbought and oversold, divergences |
| Volatility | Bands, channels and ranges: how much price moves |
| Volume | What volume says about a move: flow, accumulation, profiles |
| Price | Price itself transformed: pivots, swings, fractals, zig zag, typical price |
The pages of this section, in the menu at the left, follow these groups.
All indicators#
Every indicator of the chart, by group, with the first line of its page. Click a card for what it shows, how it is calculated, how traders read it, its settings and an example on gold.
MillionAlgo#
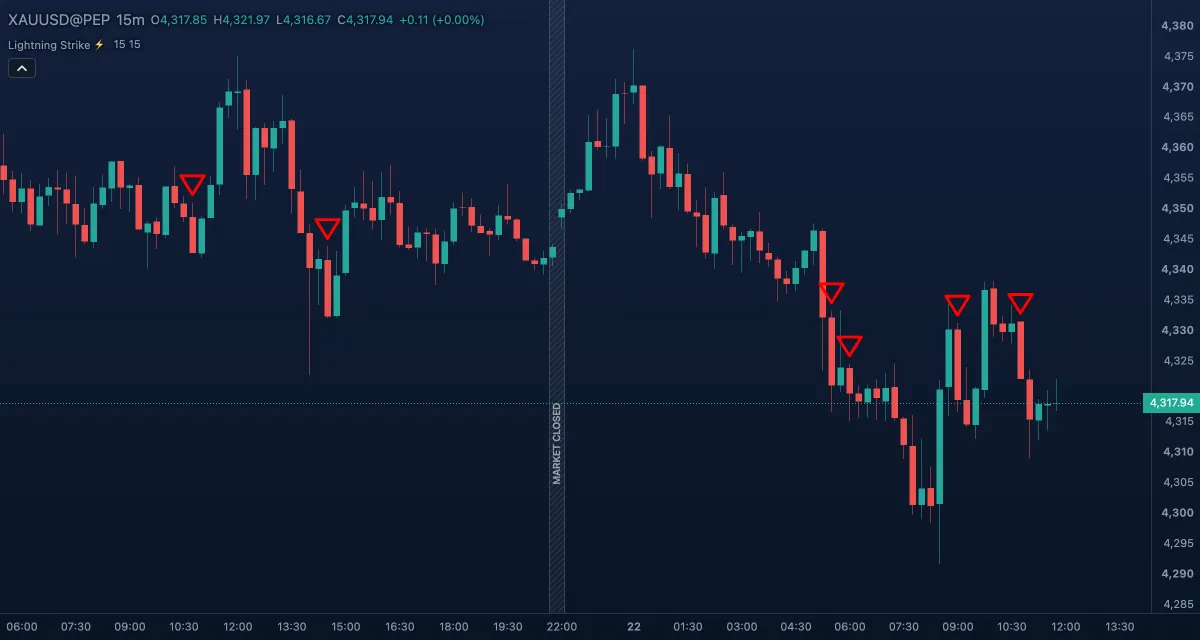 MillionAlgo Lightning StrikeLightning Strike is MillionAlgo's momentum breakout marker, and the one MillionAlgo study that is free for everyone, signed in or not.
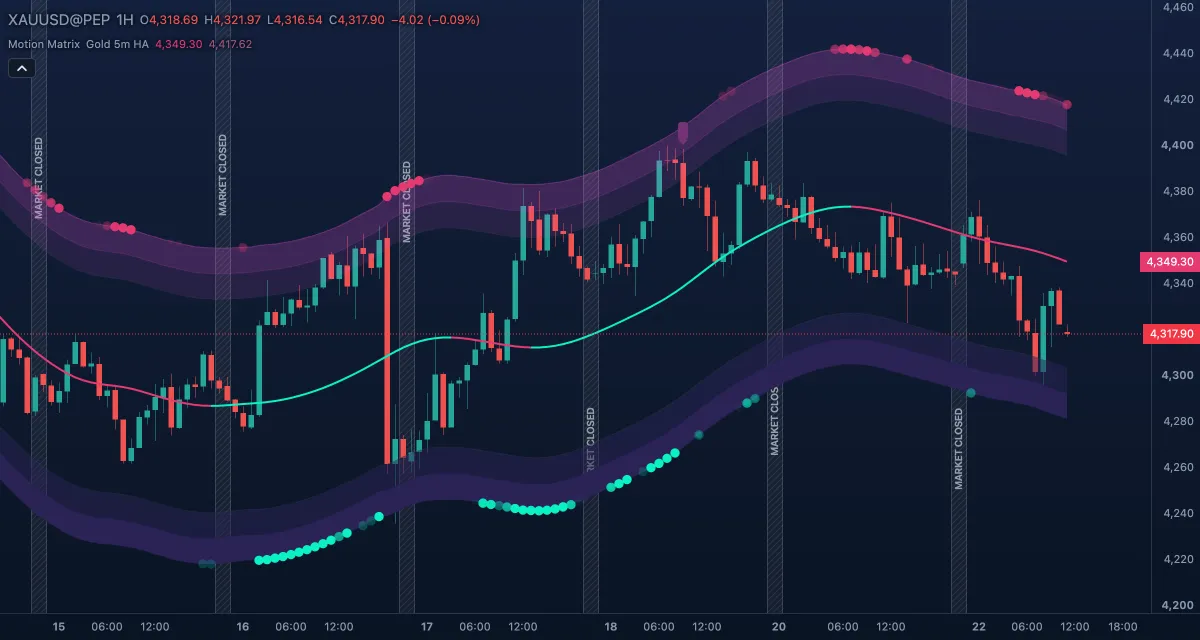 MillionAlgo Motion MatrixMotion Matrix is MillionAlgo's trend-and-volatility study.
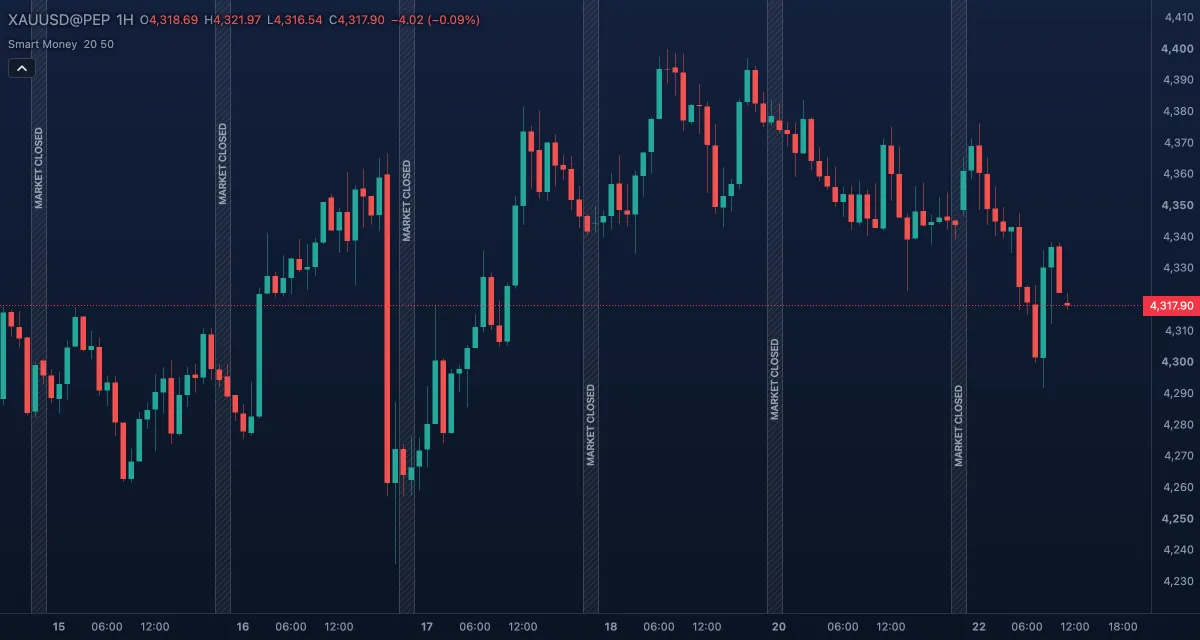 MillionAlgo Smart MoneySmart Money draws market structure for you: every break of a swing high or swing low becomes a labelled line on the candles, so you can see at a glance whether the market is making higher highs or has changed character.
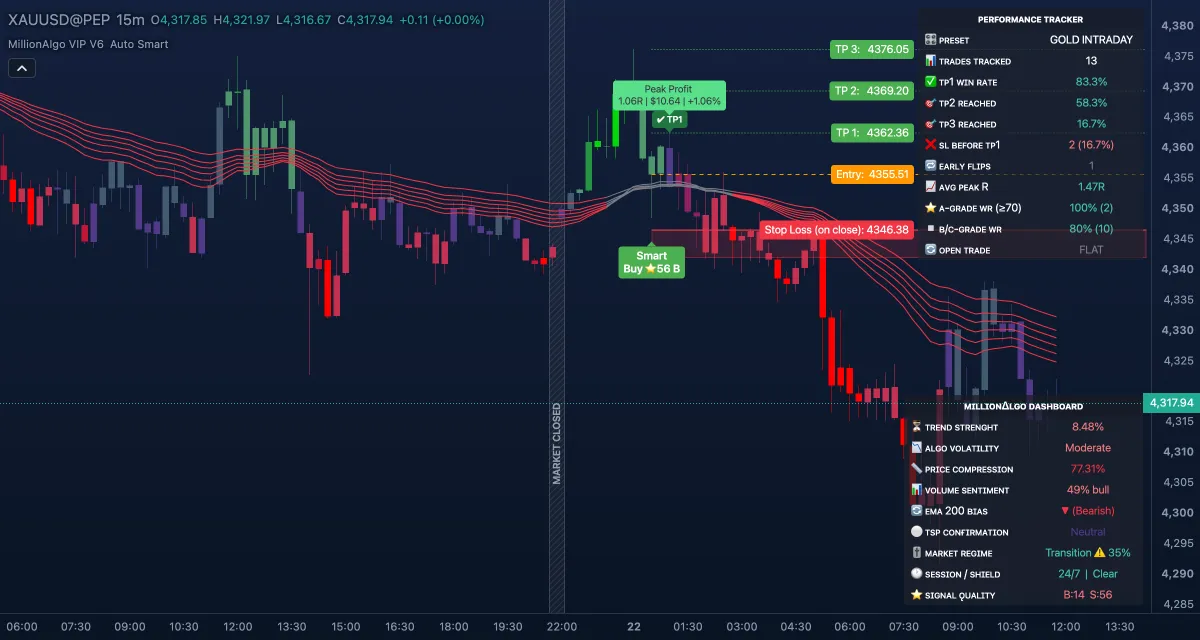 MillionAlgo VIP V6VIP V6 is MillionAlgo's complete setup engine: it finds Buy and Sell setups, grades each one, draws the entry, stop and targets as a ladder on the chart, colours the candles, and keeps its own dashboard and win-rate table in the corners.
Trend#
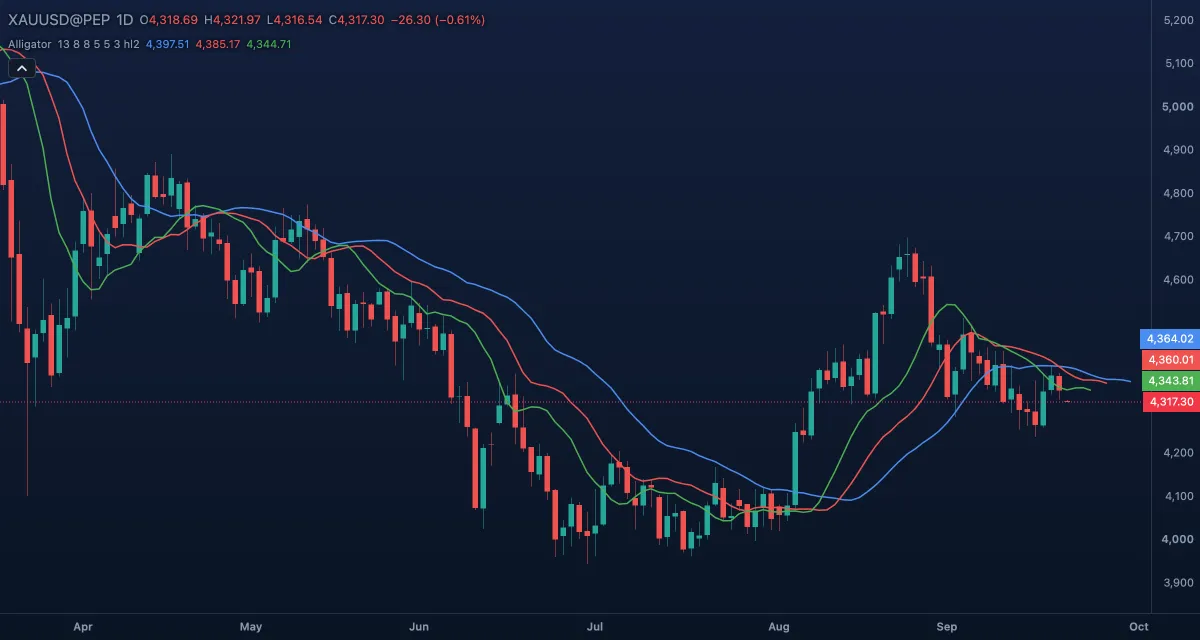 AlligatorThe Alligator is three smoothed moving averages of the middle of each candle, each pushed a few candles into the future, drawn over the candles in price units.
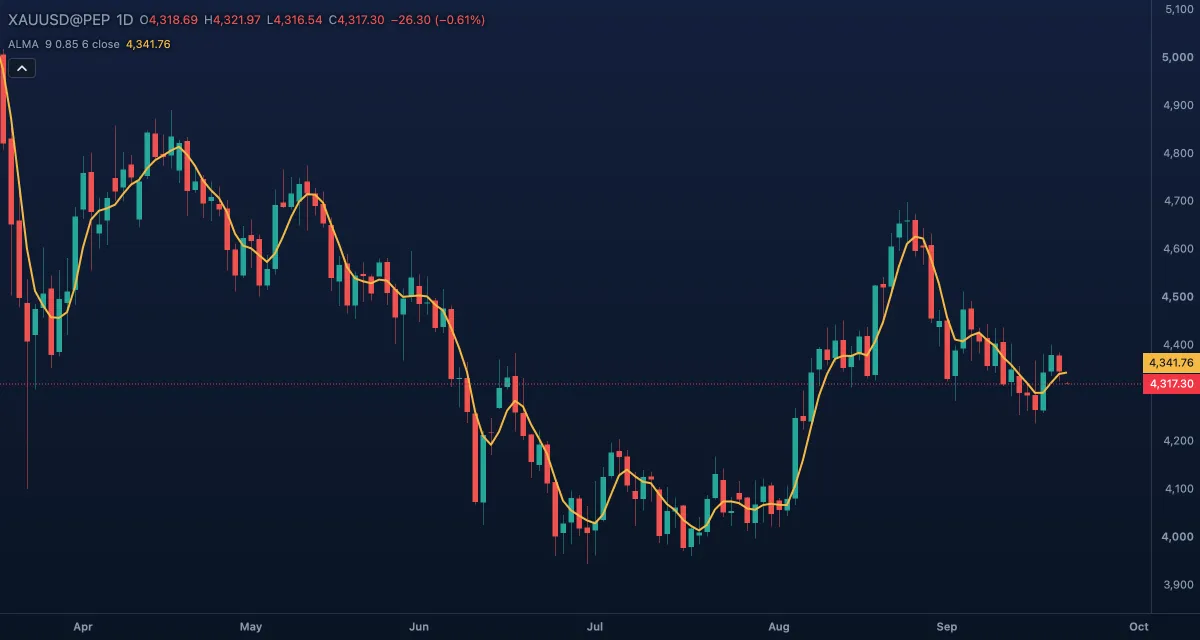 Arnaud Legoux Moving Average (ALMA)The Arnaud Legoux Moving Average (ALMA) is a moving average whose weights follow a bell curve placed near the newest candles, so the line is smooth and still close to price.
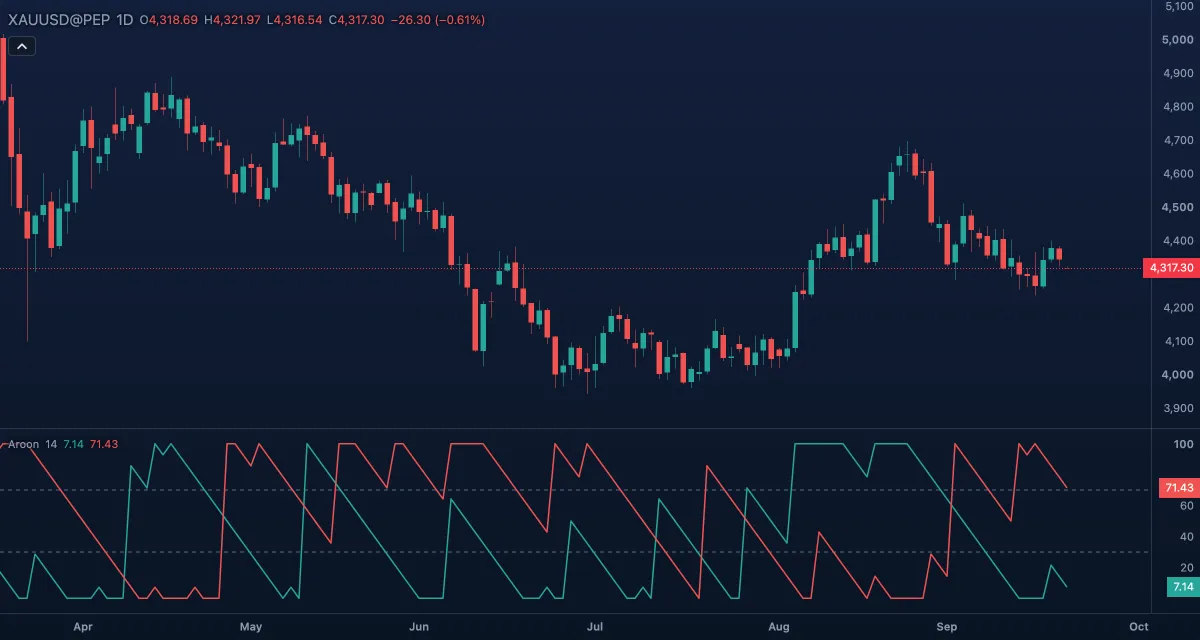 AroonAroon measures how recently the market made a new high and a new low, on a scale from 0 to 100.
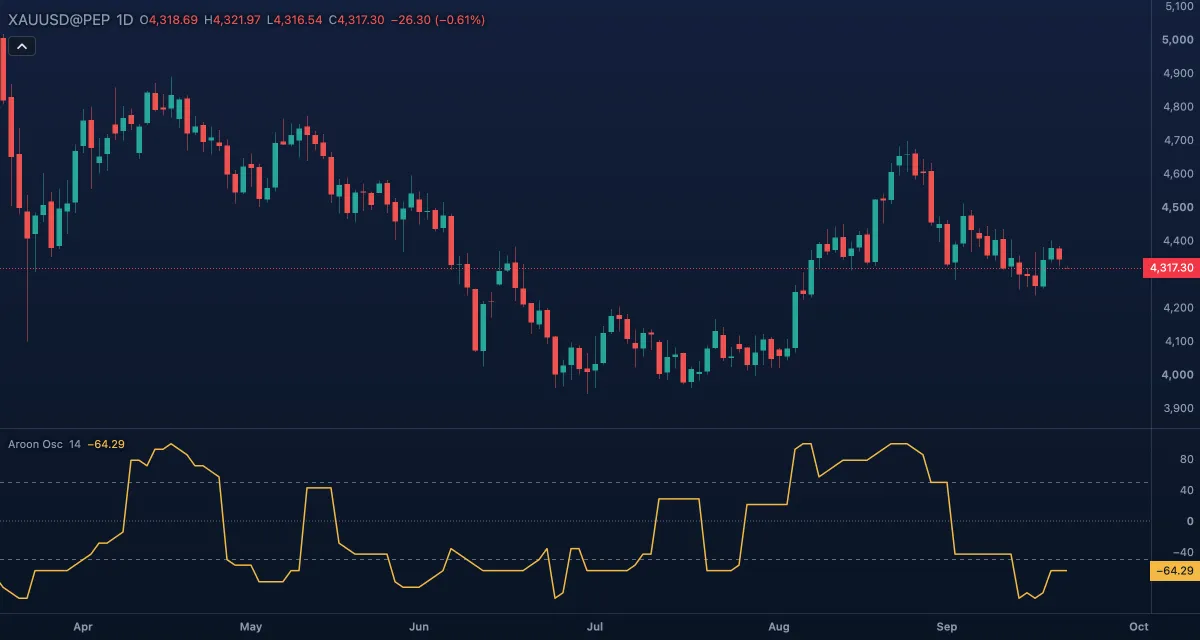 Aroon OscillatorThe Aroon Oscillator is Aroon Up minus Aroon Down: one line from −100 to +100 that says which is fresher, the last high or the last low, and by how much.
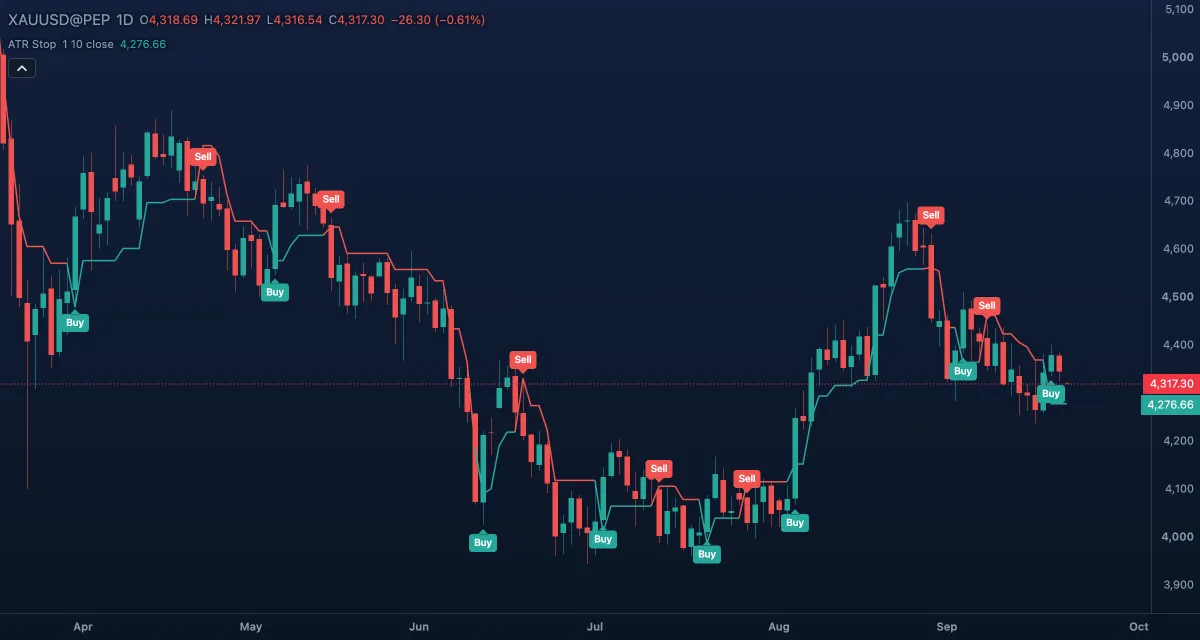 ATR Trailing StopThe ATR Trailing Stop draws a line a set number of ATRs away from the price that only moves in the trade's favour, and marks a Buy where the price crosses above it and a Sell where it crosses below.
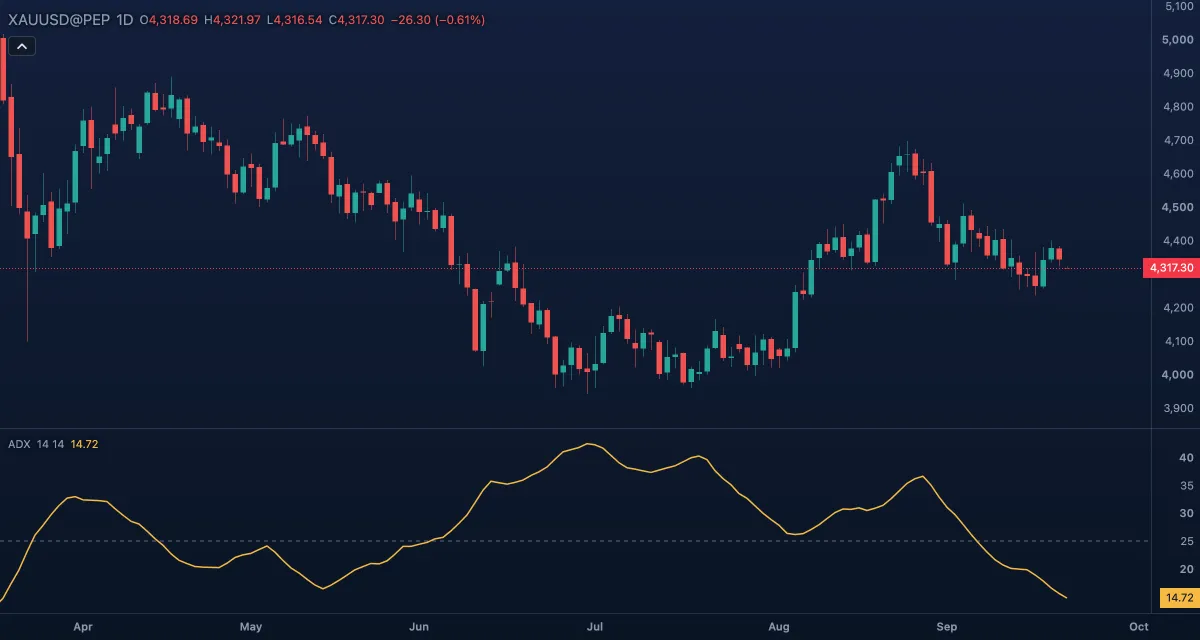 Average Directional Index (ADX)ADX measures the strength of a trend without saying which way it points: a rising ADX means the market is trending, up or down, and a low ADX means it is drifting.
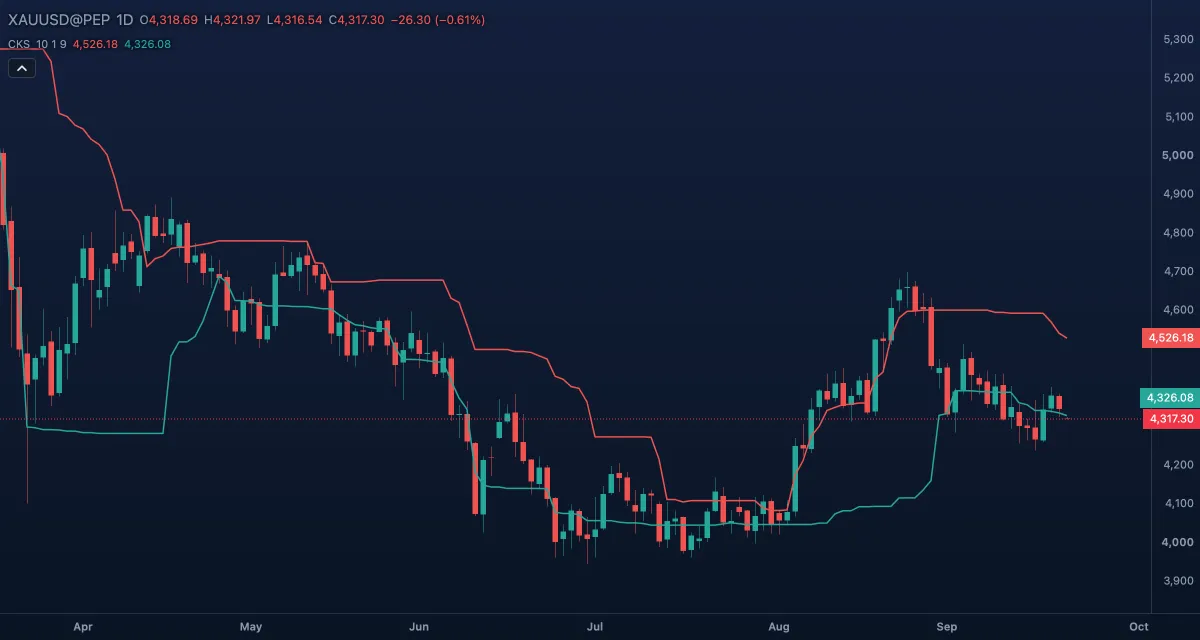 Chande Kroll StopThe Chande Kroll Stop draws two stop lines on the candles — one for long positions, one for short — at a distance set by the ATR (the average true range, a measure of how much the bars move).
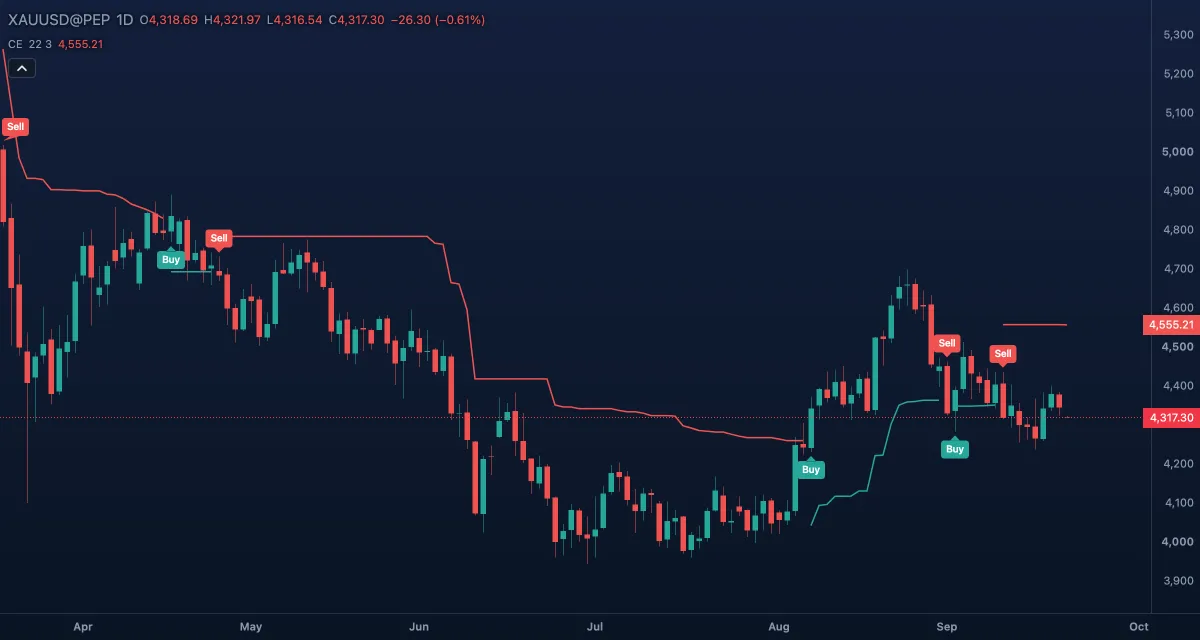 Chandelier ExitThe Chandelier Exit is a trailing stop that hangs from the highest point of a trade, a set number of ATRs below it — like a chandelier from a ceiling.
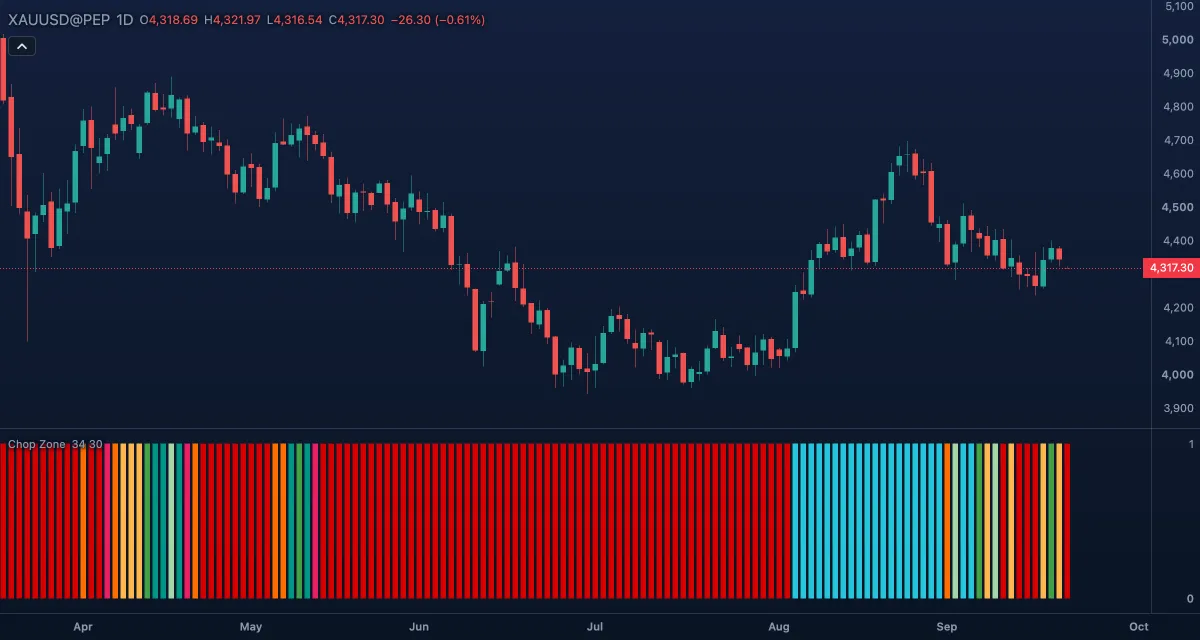 Chop ZoneChop Zone shows the slope of a 34-bar exponential moving average as a row of coloured columns under the chart: shades of green while the average rises, shades of red and orange while it falls, and yellow while it is flat — the "chop zone", where trend trades are not worth taking.
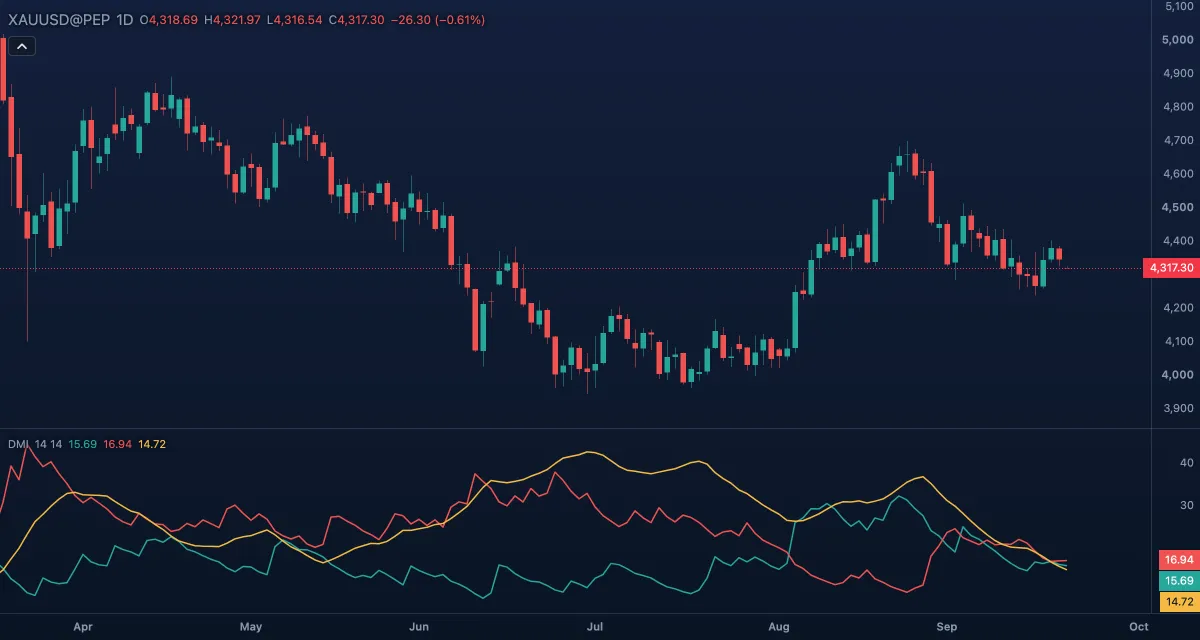 Directional Movement Index (DMI)The Directional Movement Index is Wilder's full trend system in one pane: +DI measures upward movement, −DI measures downward movement, and ADX measures how strong the trend is whichever way it points.
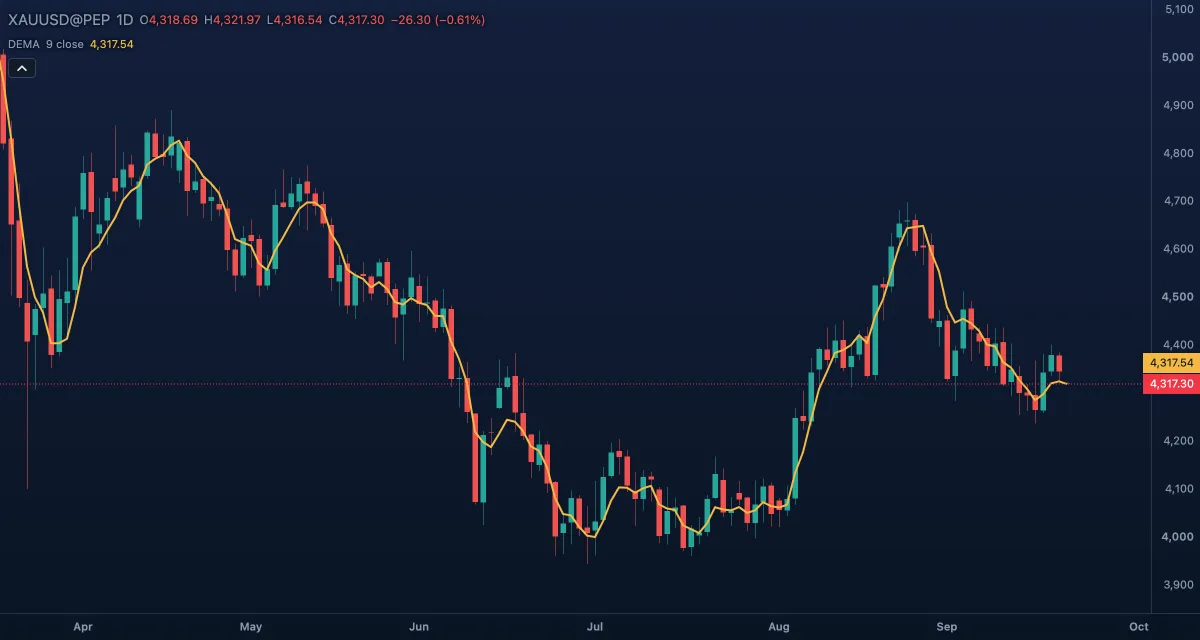 Double Exponential Moving Average (DEMA)The Double Exponential Moving Average (DEMA) is an exponential moving average with much of its lag removed: it hugs price more closely than an EMA of the same length and turns sooner.
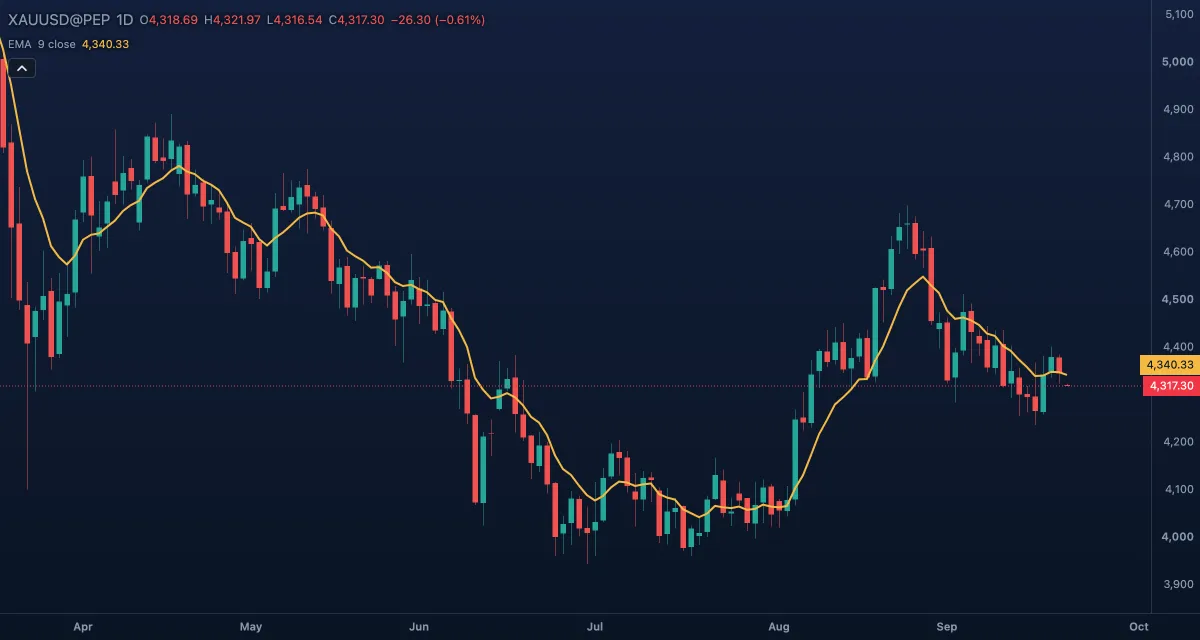 Exponential Moving Average (EMA)The Exponential Moving Average (EMA) is the average price of the last few candles, weighted so that the newest candles count the most.
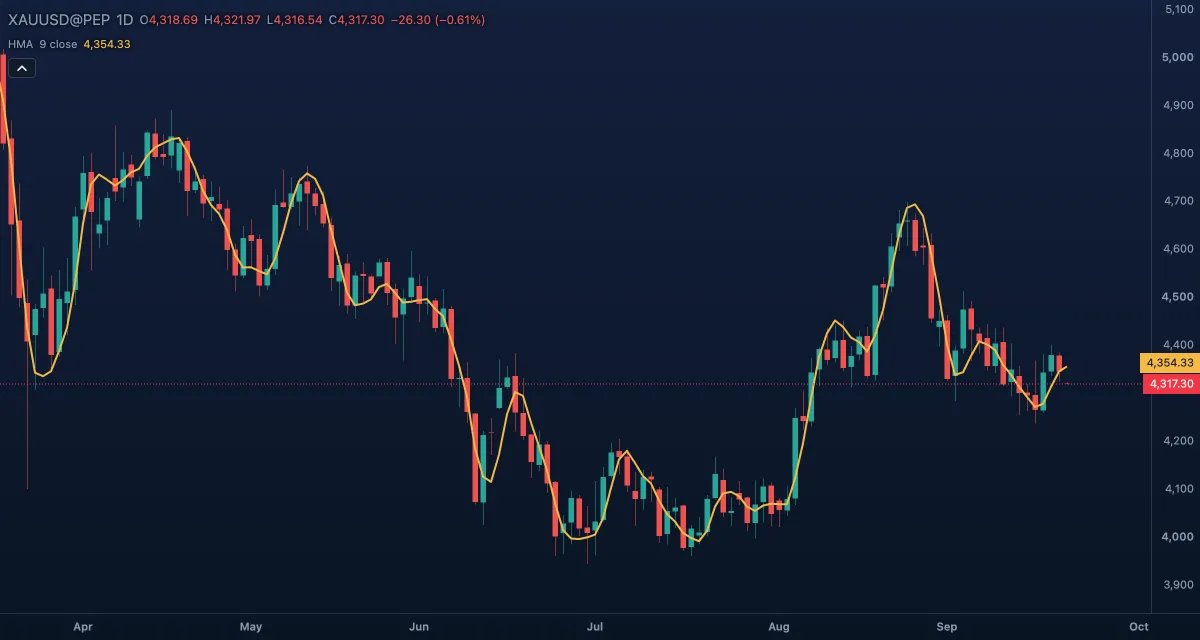 Hull Moving Average (HMA)The Hull Moving Average (HMA) is a moving average built to be both smooth and quick: it follows turns in price almost at once, yet draws a clean curve.
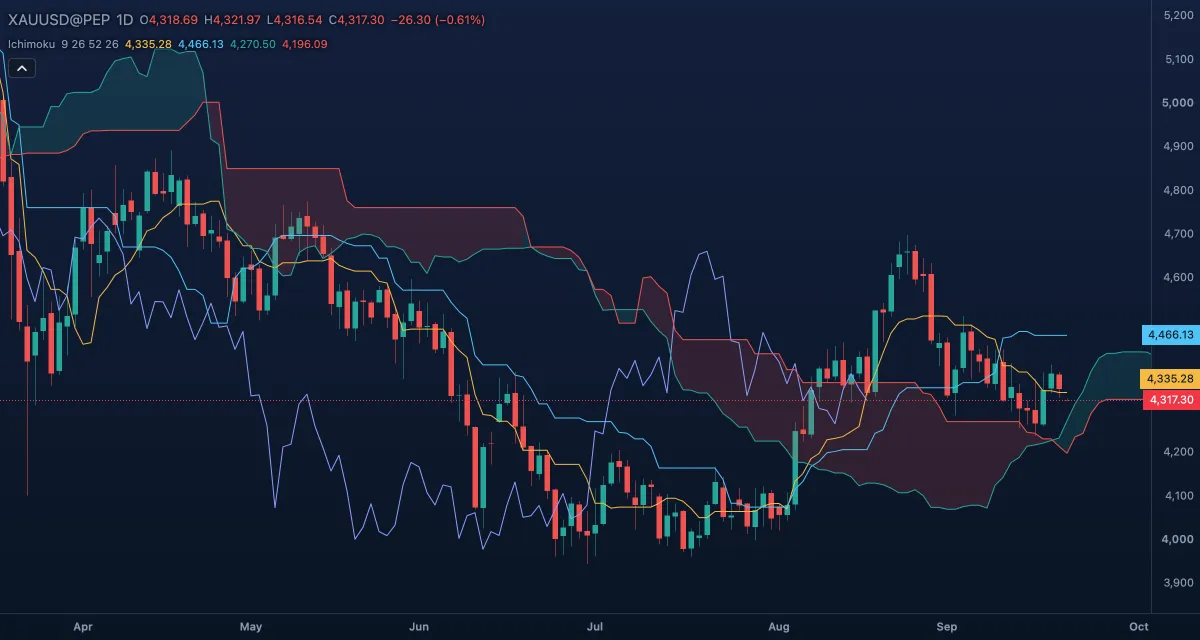 Ichimoku Kinko HyoIchimoku Kinko Hyo ("one-glance equilibrium chart") is a complete trend system drawn over the candles: two moving midlines, a cloud projected into the future, and a copy of the close shifted into the past.
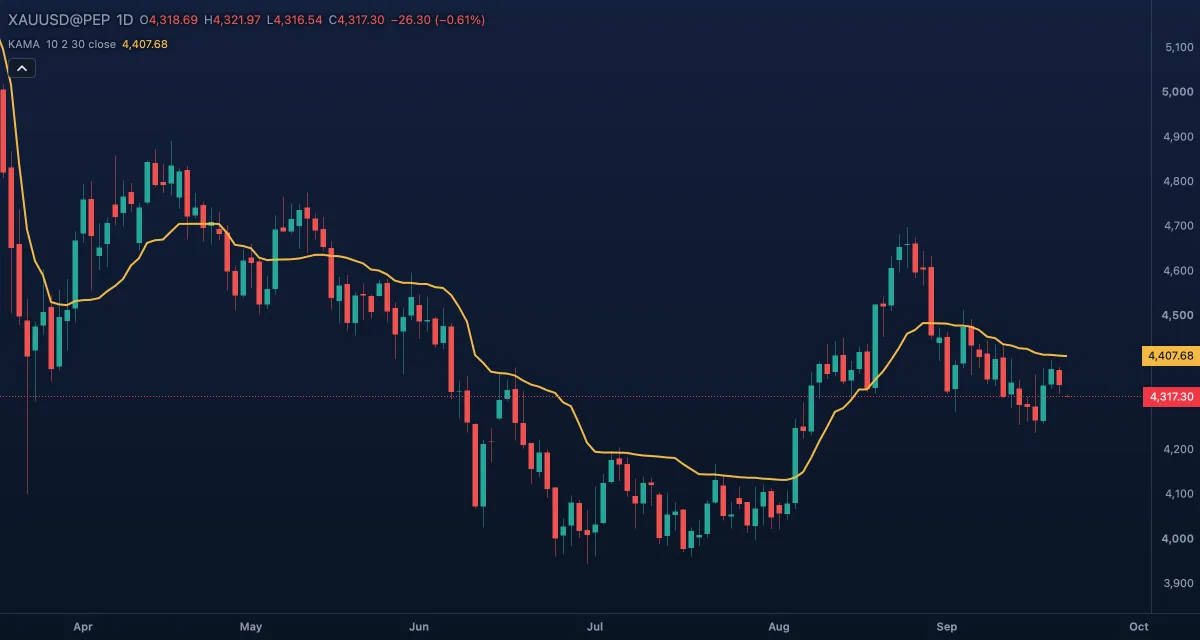 Kaufman Adaptive Moving Average (KAMA)The Kaufman Adaptive Moving Average (KAMA) is a moving average that changes its own speed: it follows price closely when the market moves in a straight line and barely moves when the market is noisy.
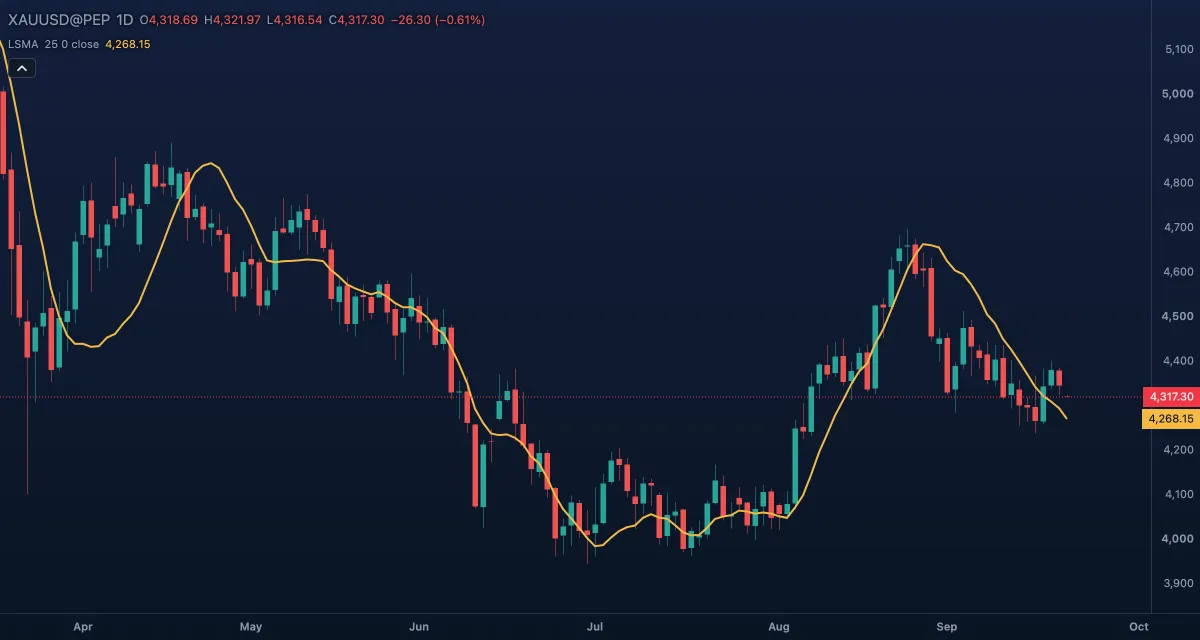 Least Squares Moving Average (LSMA)The Least Squares Moving Average (LSMA) draws, for every candle, the end point of the straight line that best fits the last few closes; it is also called the linear regression curve or the end point moving average.
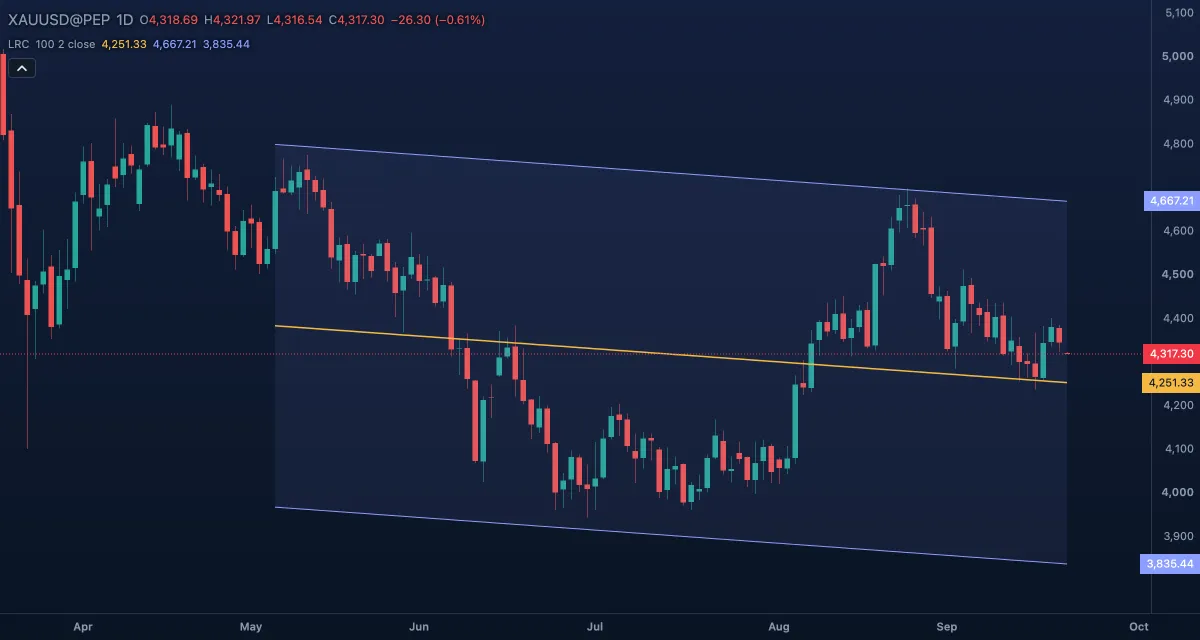 Linear Regression Channel (LRC)The Linear Regression Channel draws the straight line that fits the last 100 closes best (the least-squares line) and two parallel bands around it.
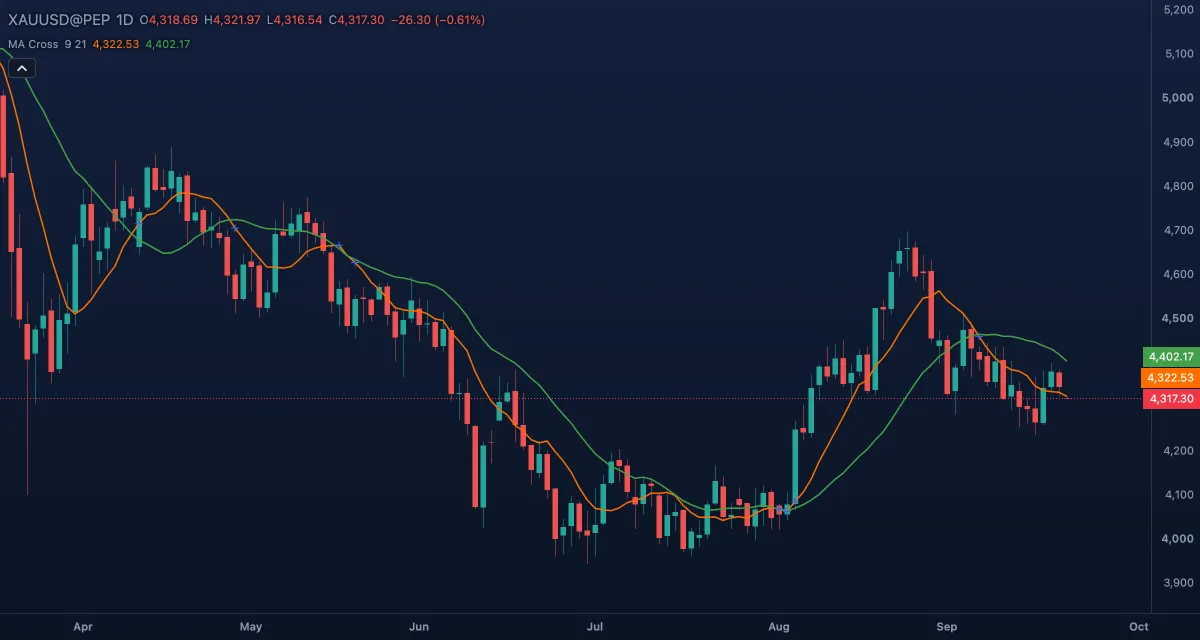 MA CrossMA Cross draws a short and a long moving average of the close and marks every bar where the two cross.
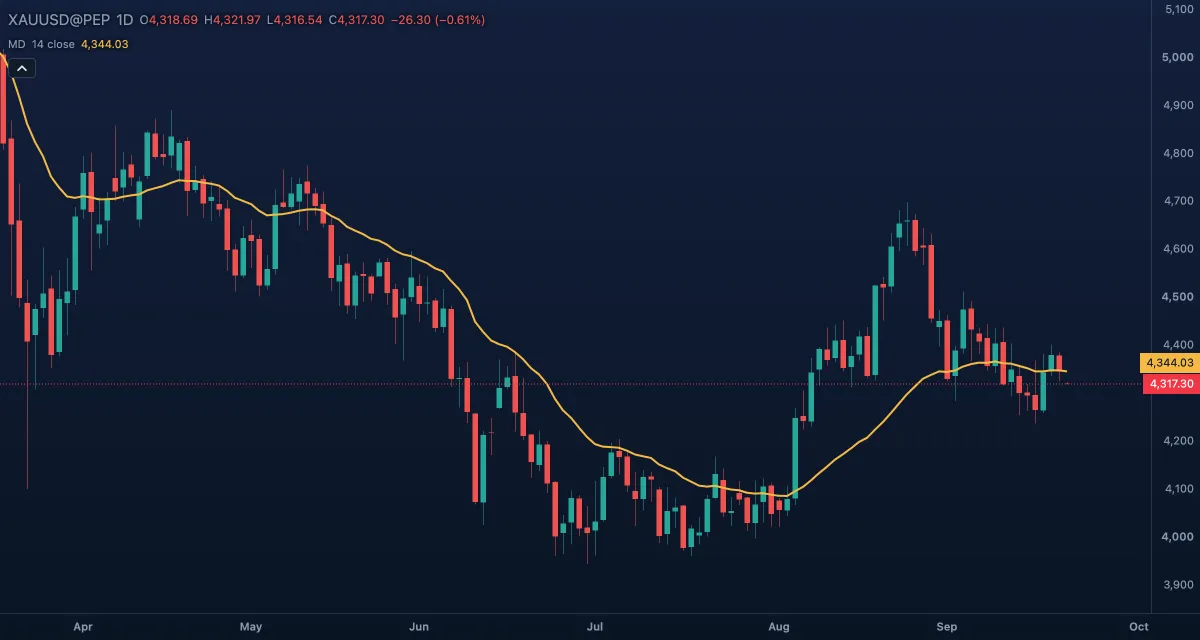 McGinley Dynamic (MD)The McGinley Dynamic is a moving average that changes its own speed with the market: it follows price closely when price moves fast and smooths it when price drifts, so it tracks a trend with less lag and fewer false crossings than a fixed average of the same length.
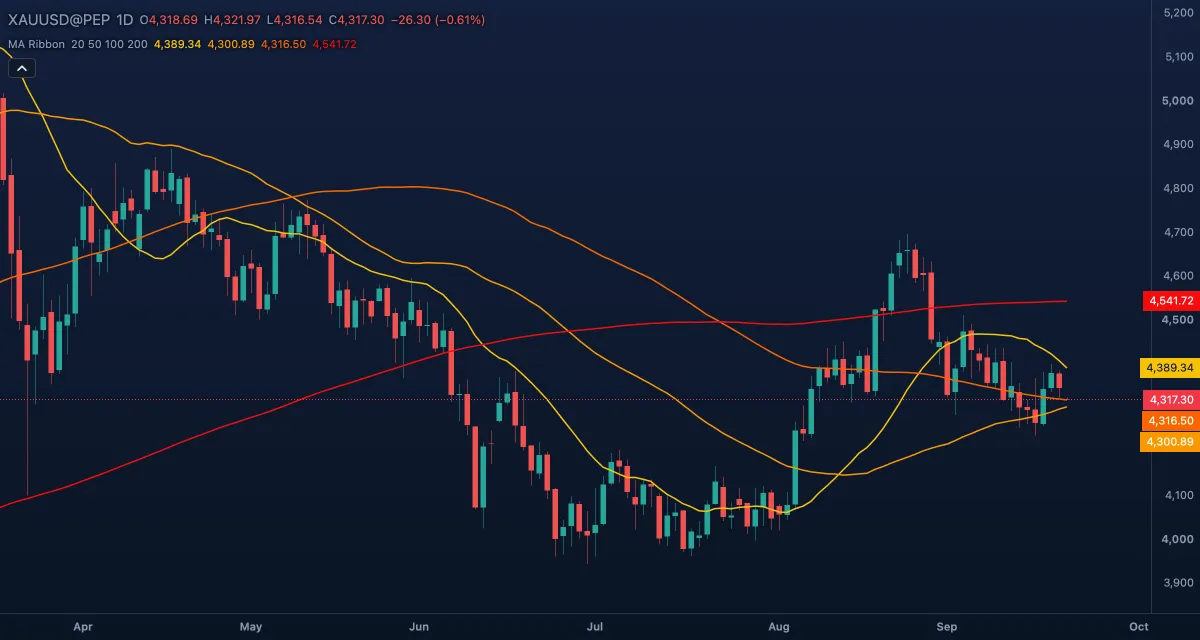 Moving Average RibbonThe Moving Average Ribbon draws four moving averages of different lengths on the candles.
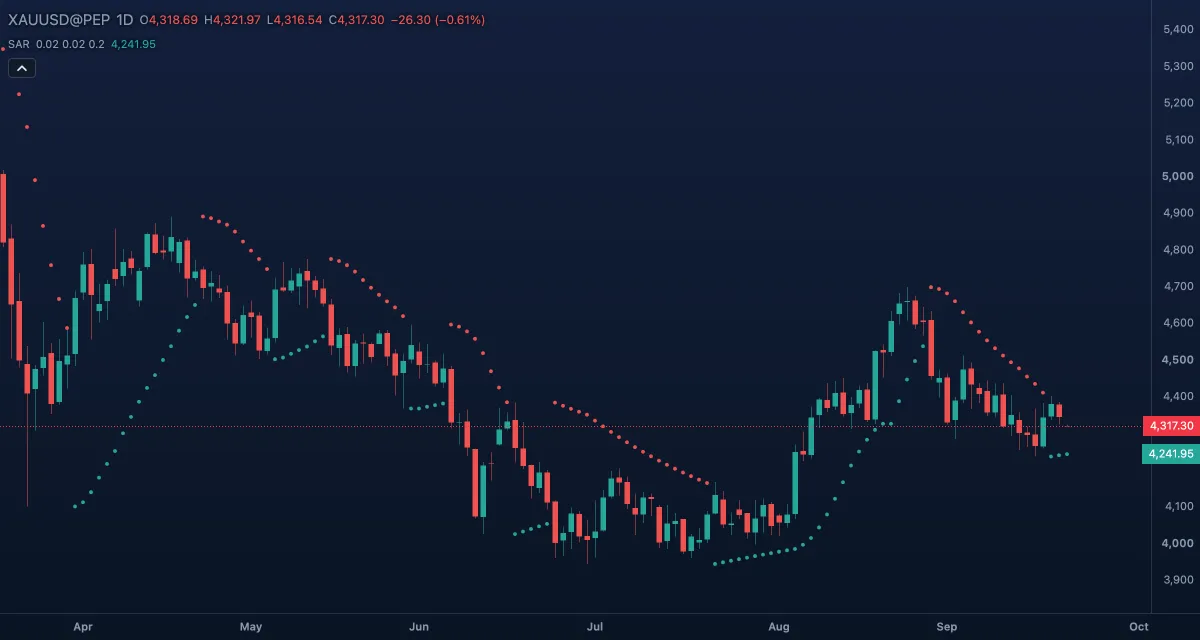 Parabolic SARParabolic SAR ("stop and reverse") draws one dot per candle that works as a trailing stop: the dots run below the price while it rises and above it while it falls, and jump to the other side when the price crosses them.
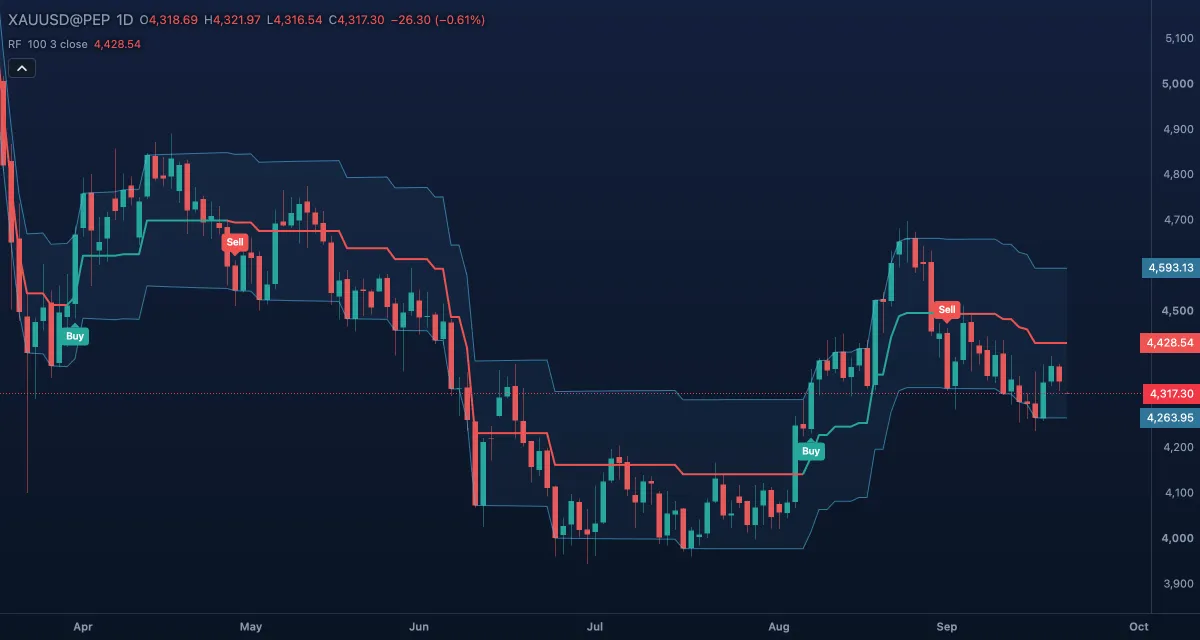 Range FilterThe Range Filter is a line that follows the price only when the price moves further than its usual range; otherwise it holds still.
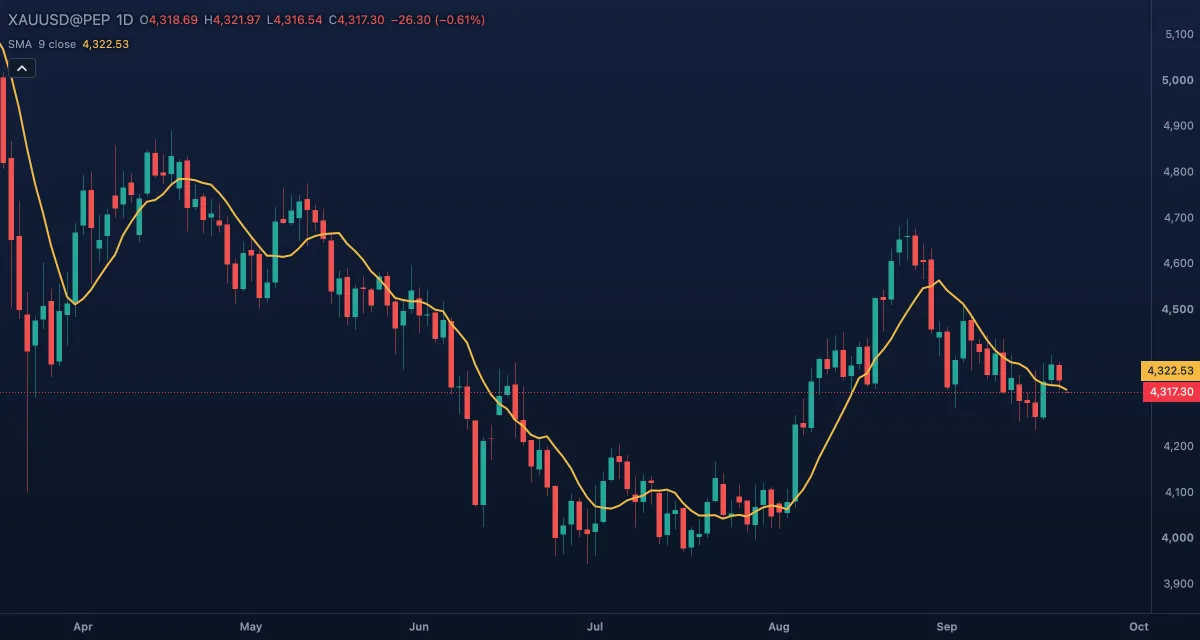 Simple Moving Average (SMA)The Simple Moving Average (SMA) is the plain average of the last few closes, drawn as one line over the candles in the price's own units.
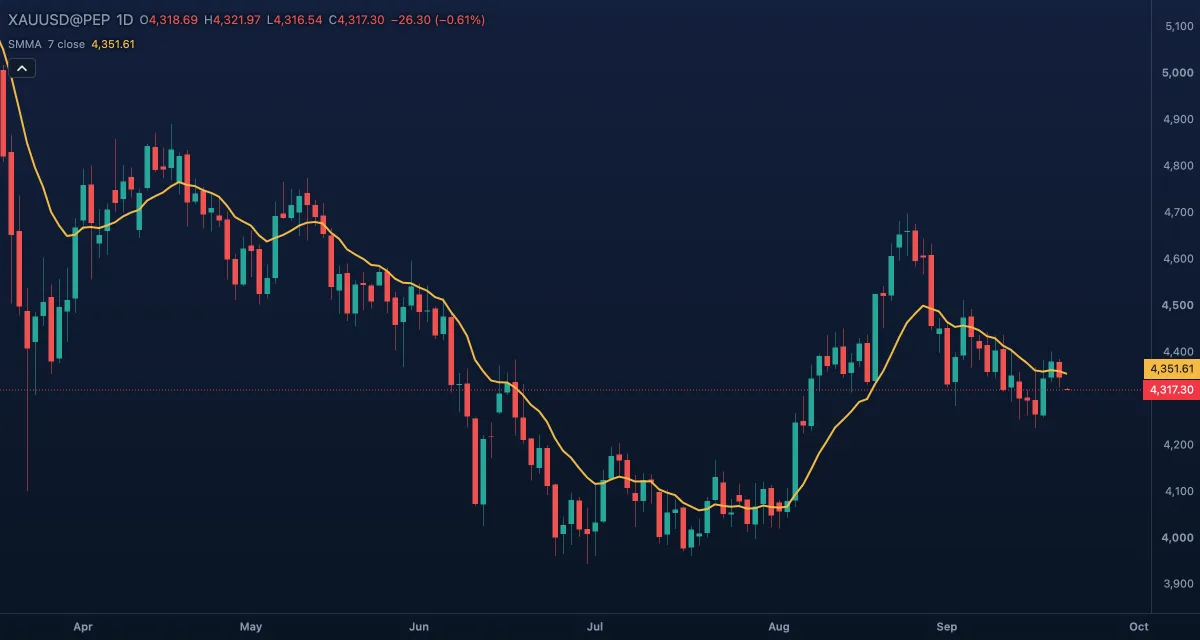 Smoothed Moving Average (SMMA)The Smoothed Moving Average is a moving average that moves one N-th of the way towards each new price.
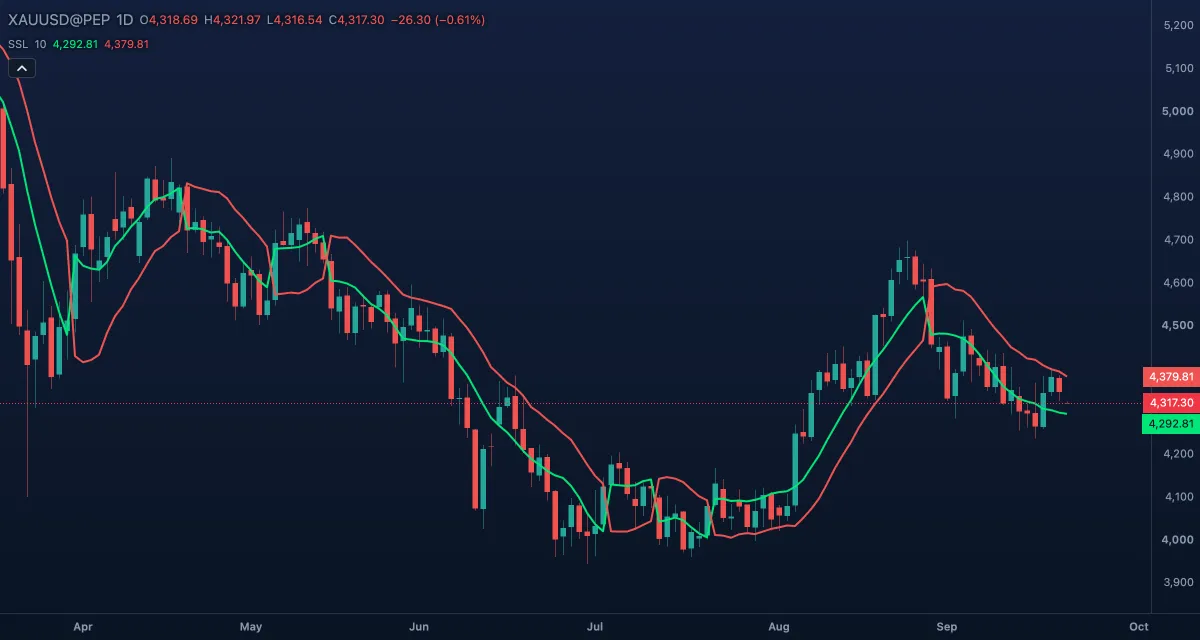 SSL ChannelThe SSL Channel draws two moving averages — one of the highs, one of the lows — and swaps their colours when the close breaks out of them.
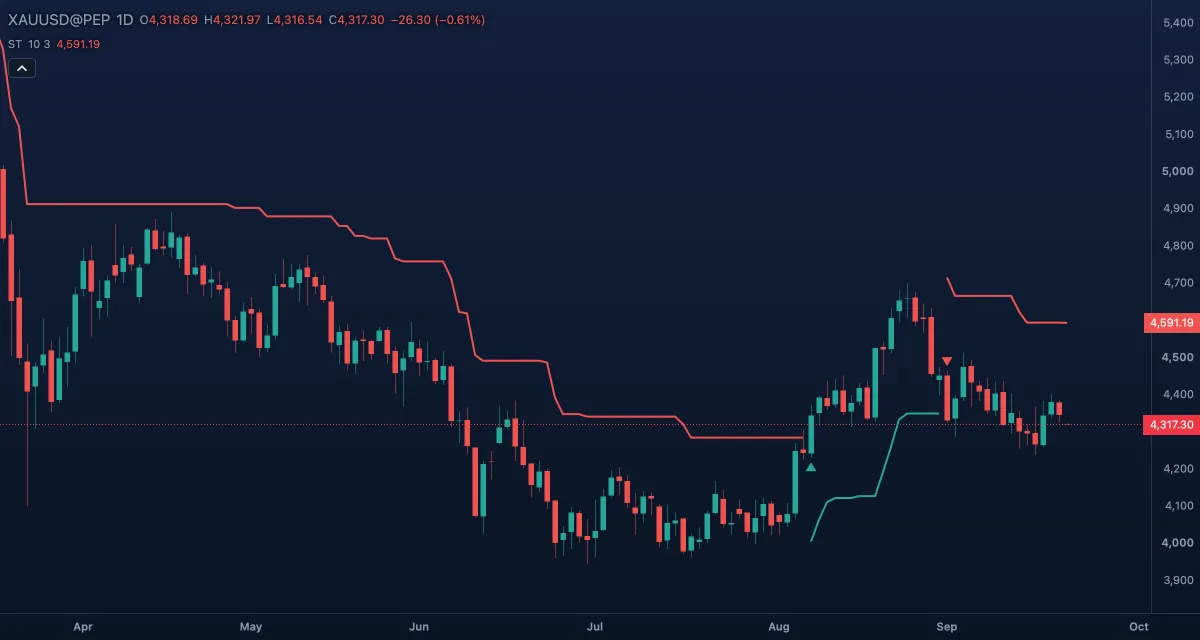 SuperTrendSuperTrend is a trend-following stop line drawn over the candles: below price while the trend is up, above price while it is down.
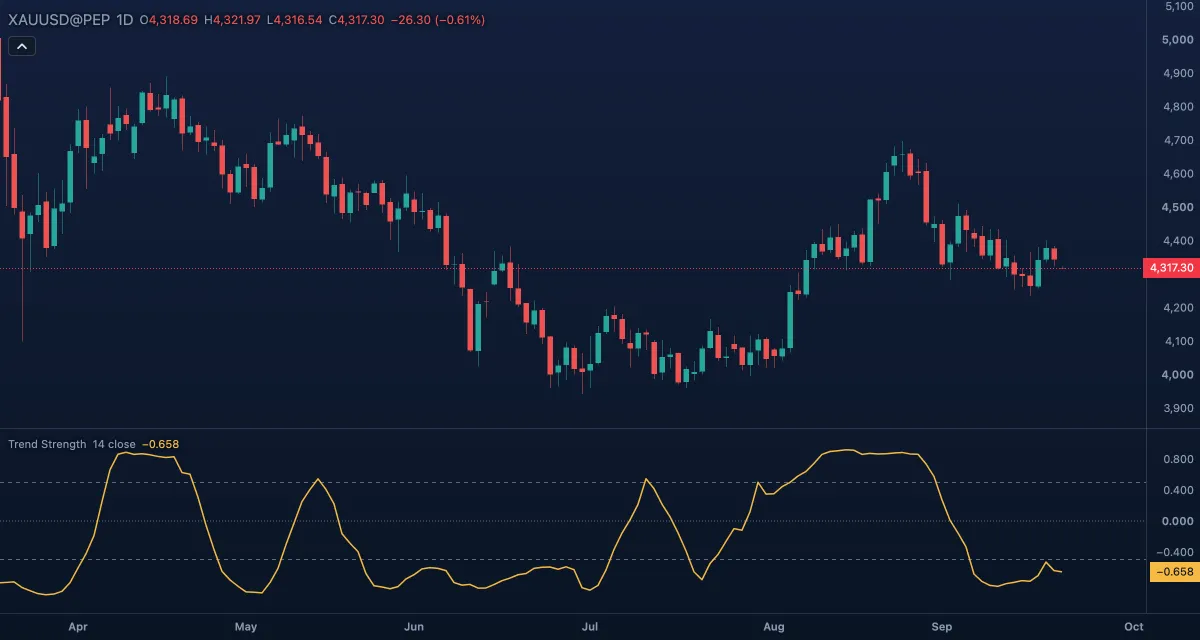 Trend Strength IndexThe Trend Strength Index measures how straight the price has moved over the last 14 bars: it is the correlation between the close and time, so it reads +1 for a steady rise, −1 for a steady fall and about 0 when there is no trend.
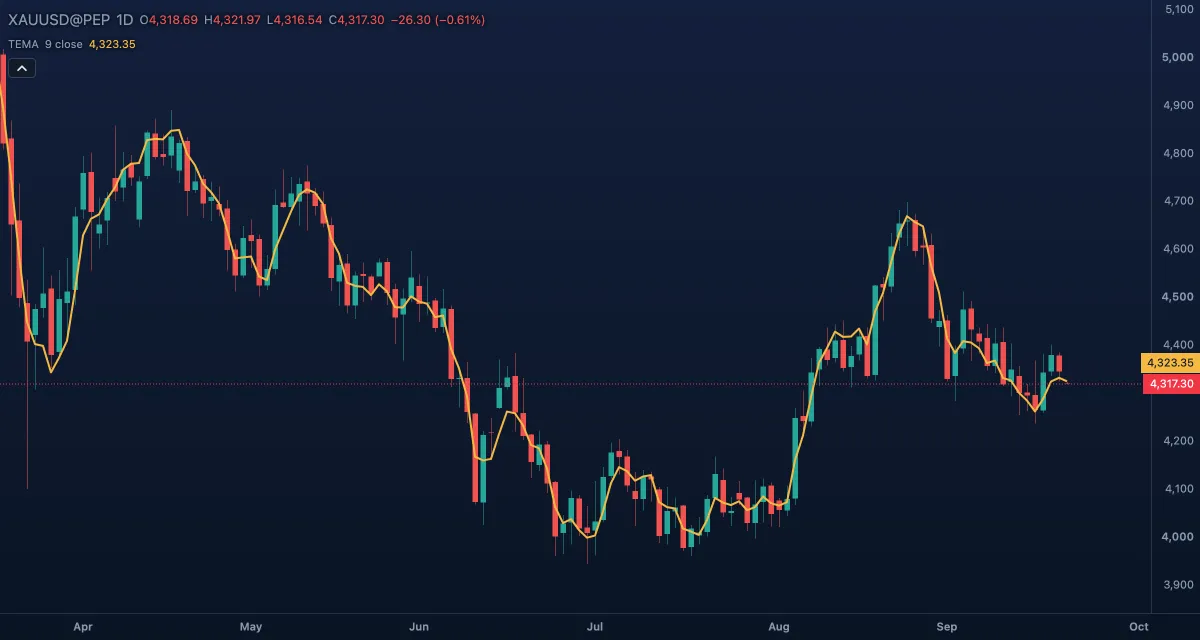 Triple Exponential Moving Average (TEMA)The Triple Exponential Moving Average is a fast moving average: it combines an EMA, the EMA of that EMA and the EMA of that, in a way that cancels most of the lag of a single EMA of the same length.
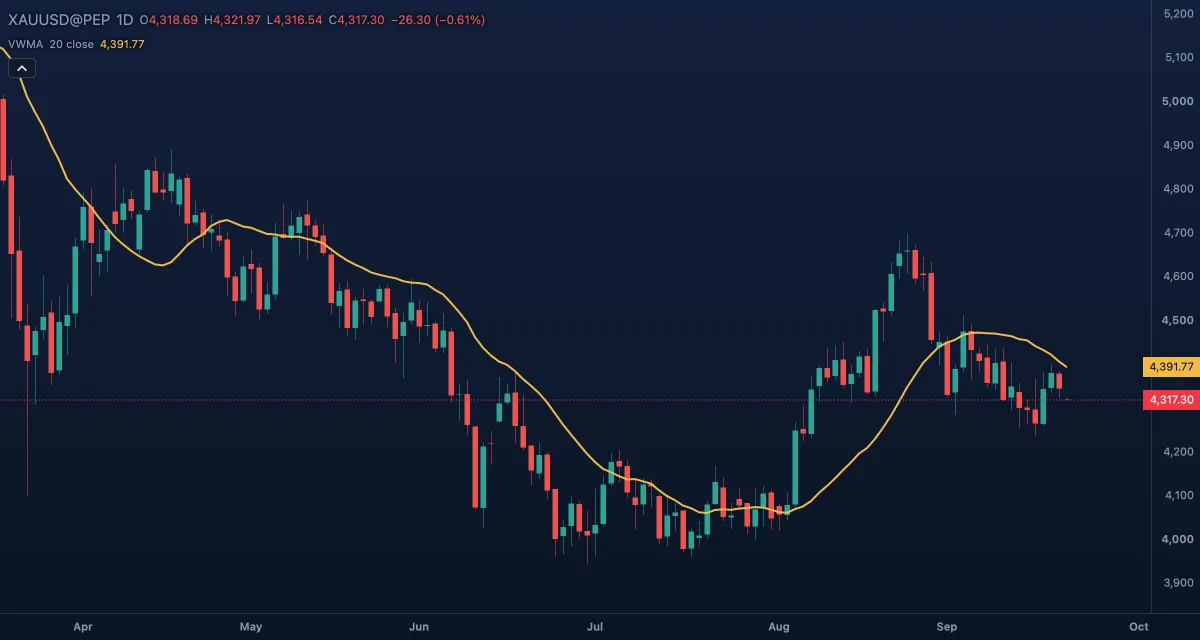 Volume-Weighted Moving Average (VWMA)The Volume-Weighted Moving Average is a moving average in which each bar counts in proportion to its volume: a bar that traded twice as much pulls the line twice as hard.
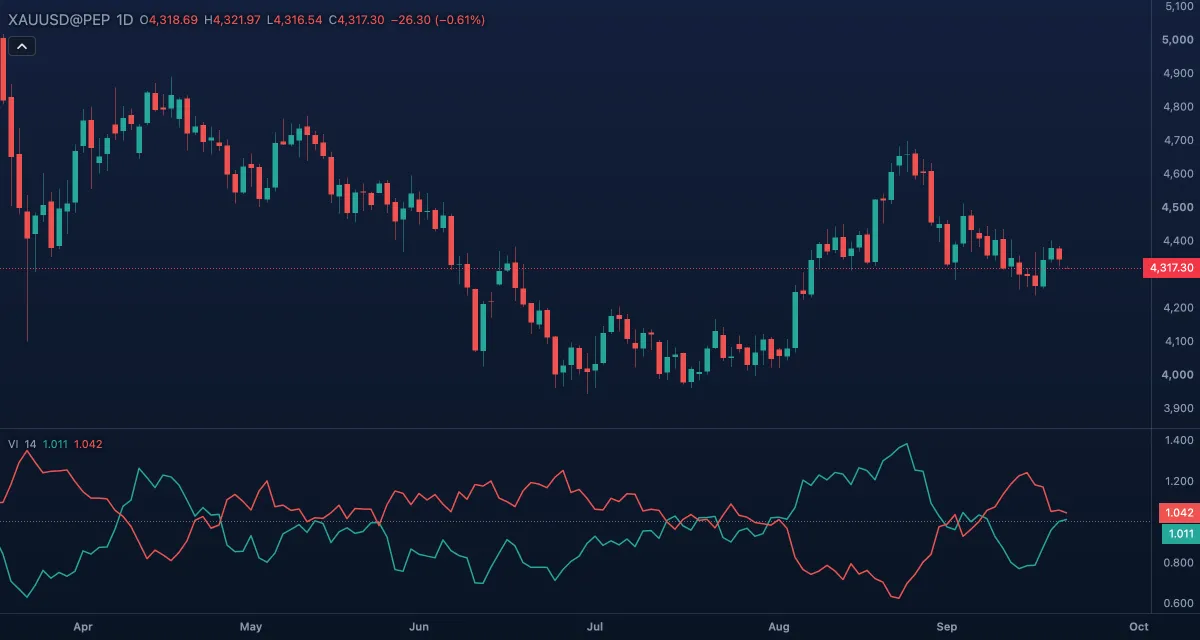 Vortex IndicatorThe Vortex Indicator compares how far the bars have pushed up with how far they have pushed down over the last 14 bars, and draws the two results as lines, VI+ and VI−, that cross when the trend turns.
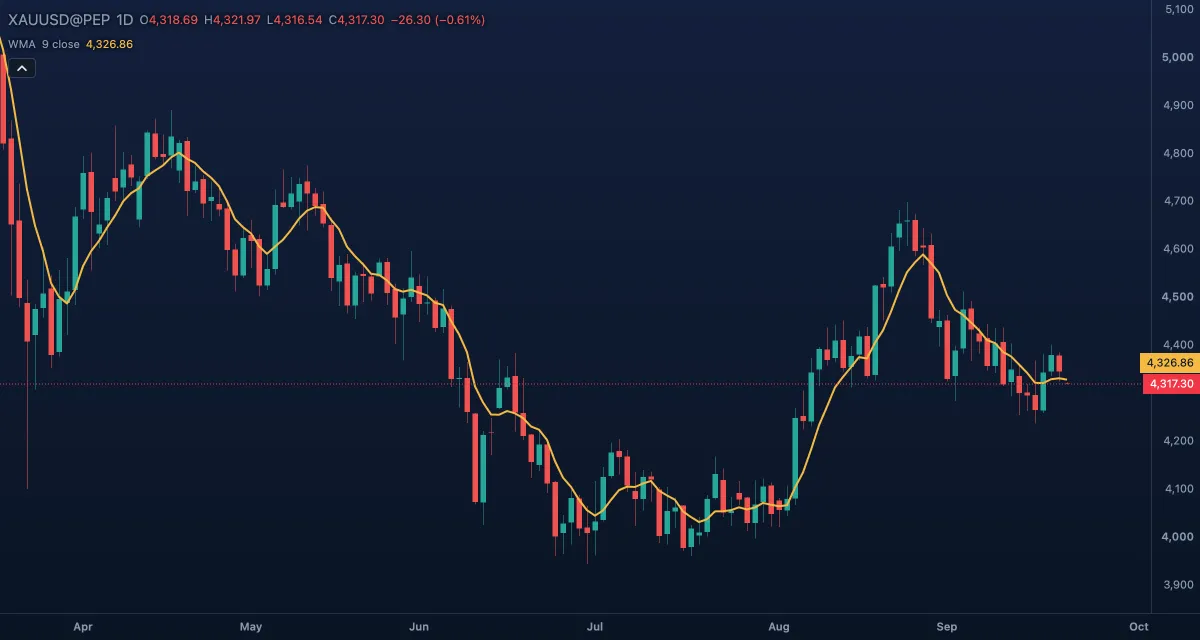 Weighted Moving Average (WMA)The Weighted Moving Average (WMA) is an average of the last few closes in which each candle counts a little more than the one before it: the newest has the heaviest weight, the oldest the lightest.
Momentum#
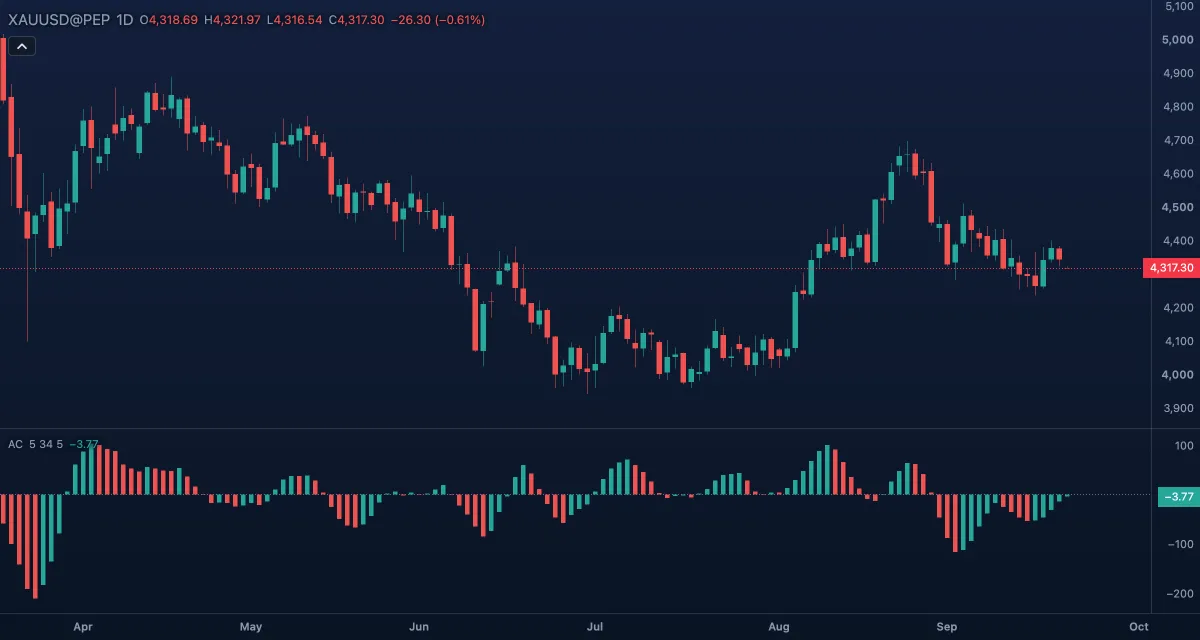 Accelerator Oscillator (AC)The Accelerator Oscillator measures whether momentum is speeding up or slowing down.
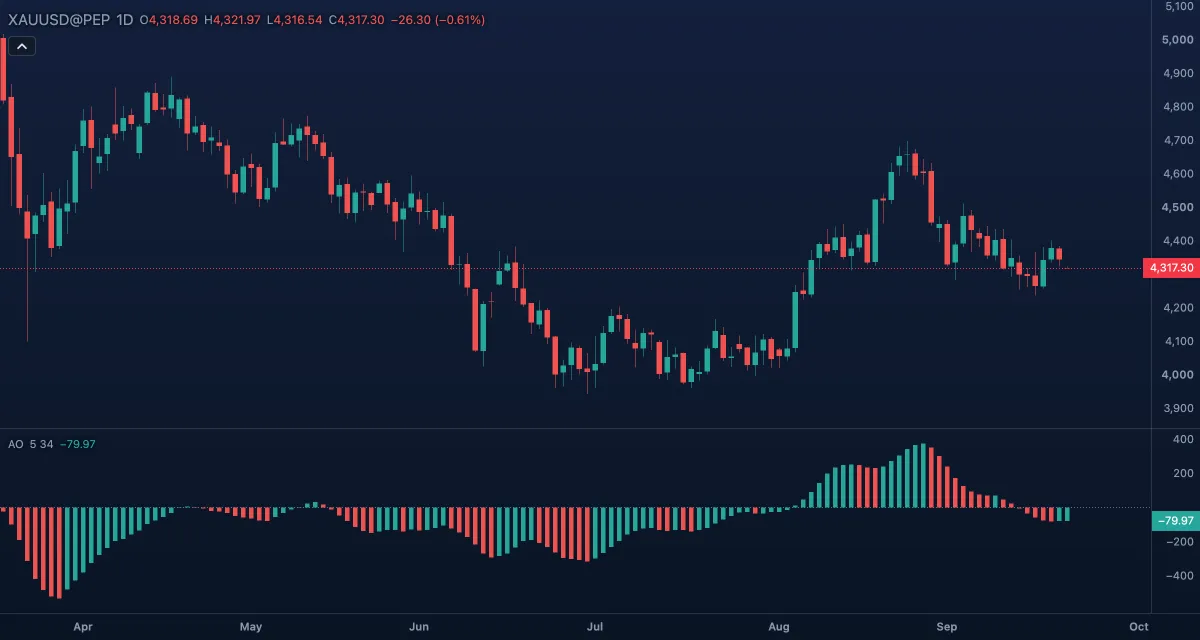 Awesome Oscillator (AO)The Awesome Oscillator compares a short average of the bar's median price with a long one; the difference shows the market's momentum over roughly the last week of bars against the last month.
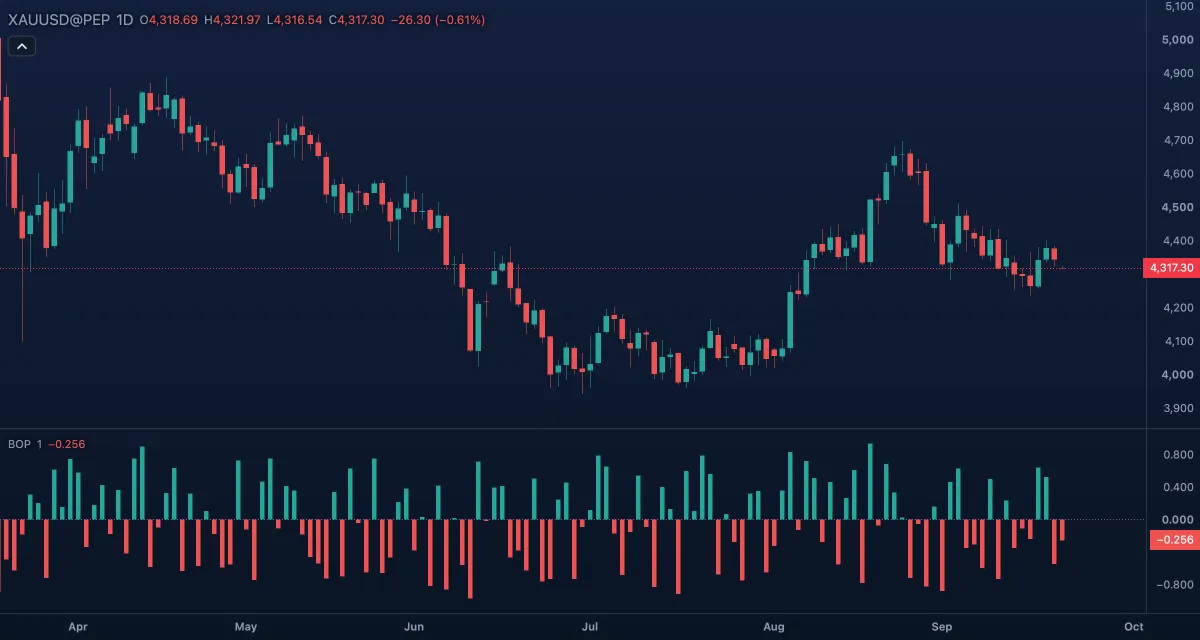 Balance of Power (BOP)Balance of Power measures who won each candle: the distance from open to close divided by the distance from low to high.
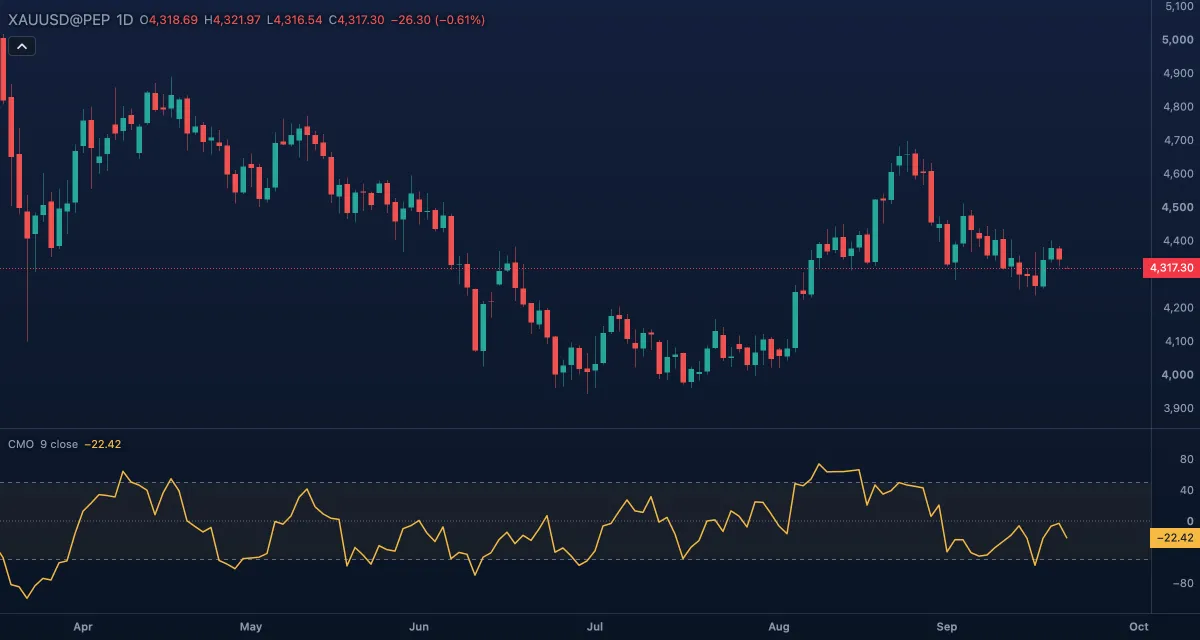 Chande Momentum Oscillator (CMO)The Chande Momentum Oscillator weighs the up moves of the last bars against the down moves and scales the balance from −100 to +100: +100 when every bar in the window closed higher than the one before, −100 when every bar closed lower, 0 when the two sides are equal.
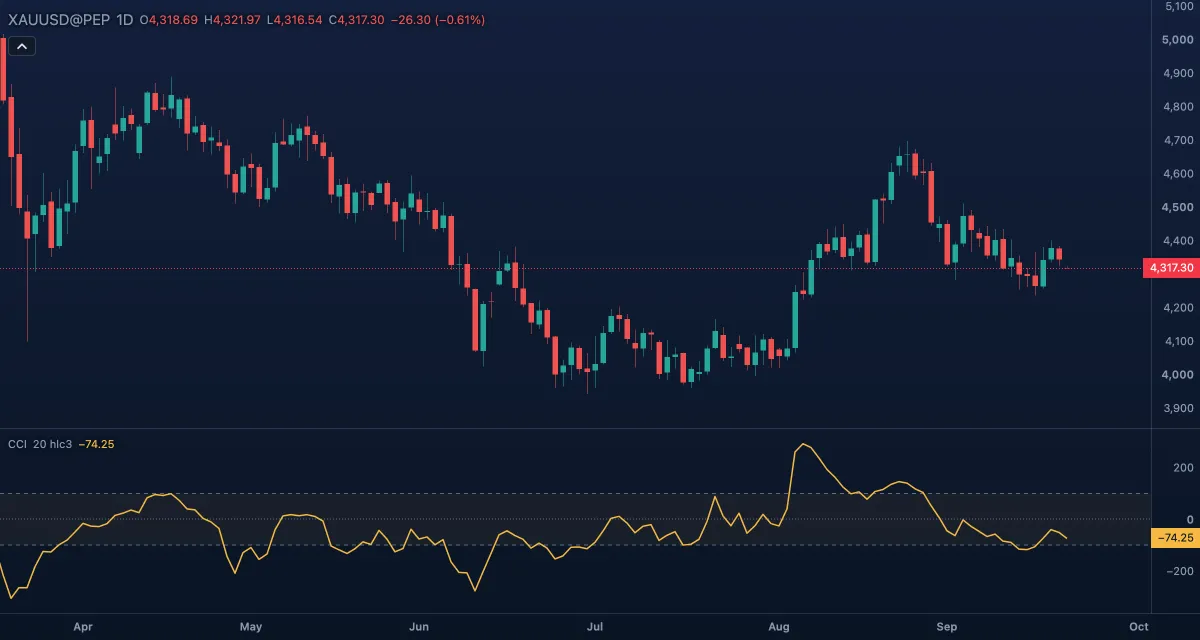 Commodity Channel Index (CCI)The Commodity Channel Index measures how far the price has moved from its own average, in units of how much it usually moves.
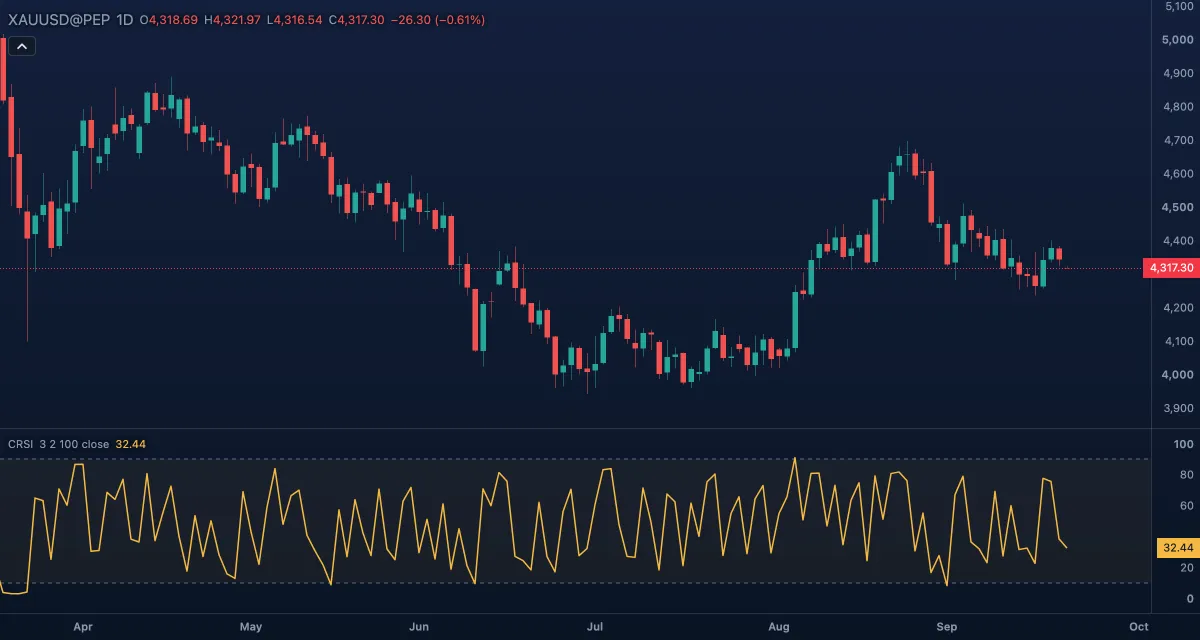 Connors RSI (CRSI)Connors RSI is a fast oscillator built for short-term mean reversion.
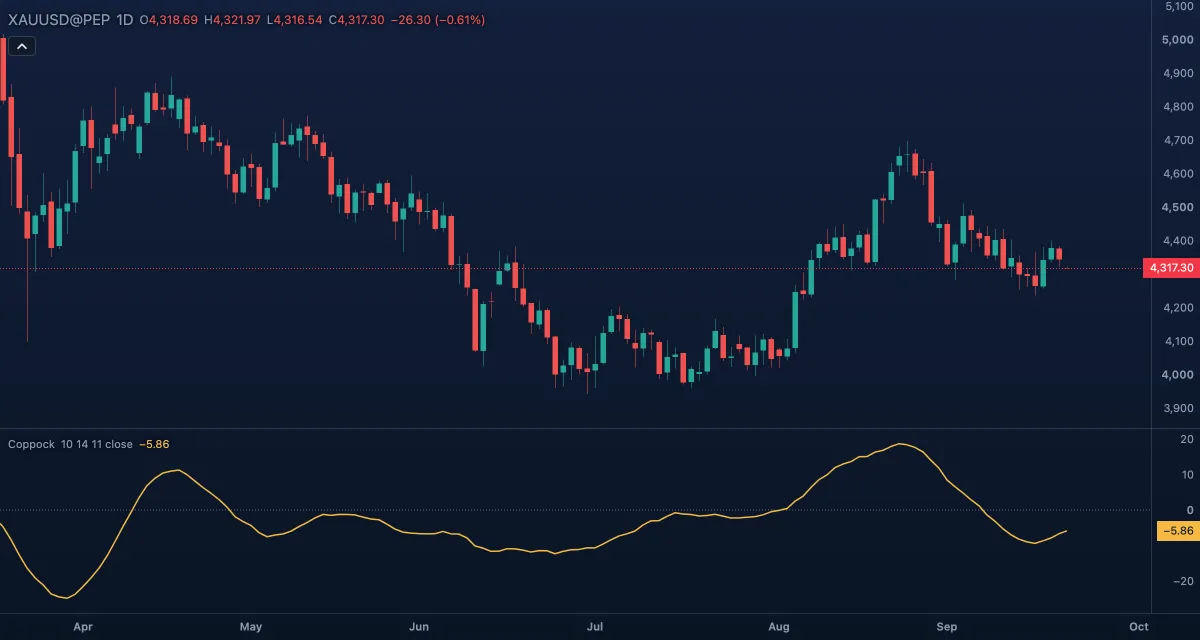 Coppock CurveThe Coppock Curve is a long-term momentum line: the sum of two rates of change of the price, smoothed with a weighted average.
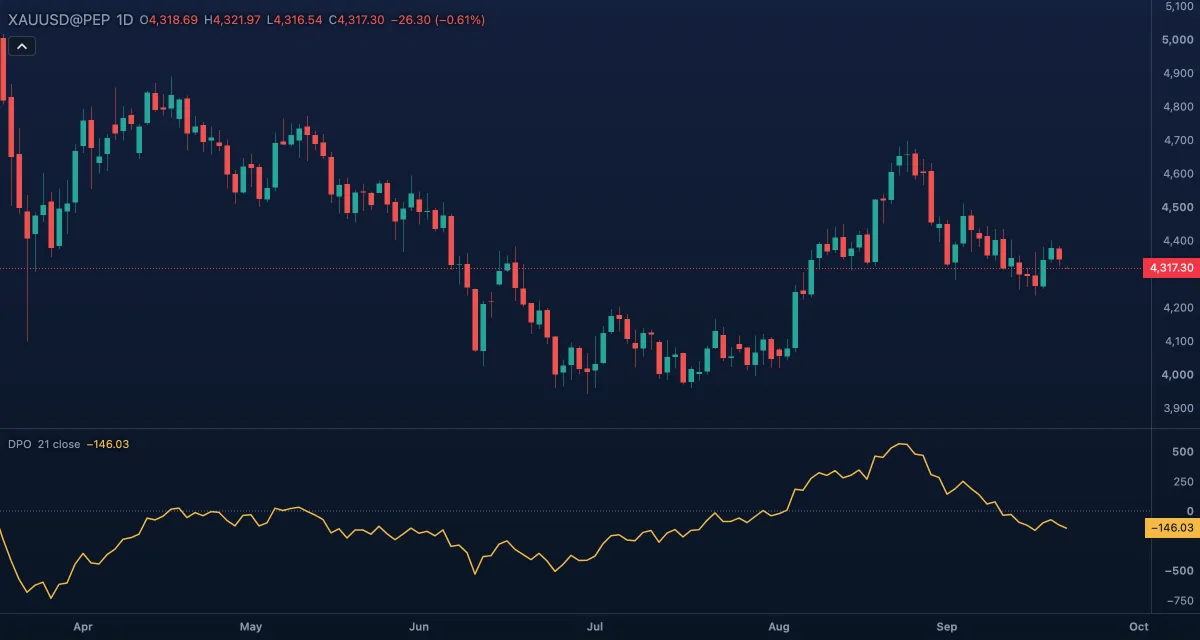 Detrended Price Oscillator (DPO)The Detrended Price Oscillator takes the trend out of the price to leave the shorter swings — the cycles — on their own.
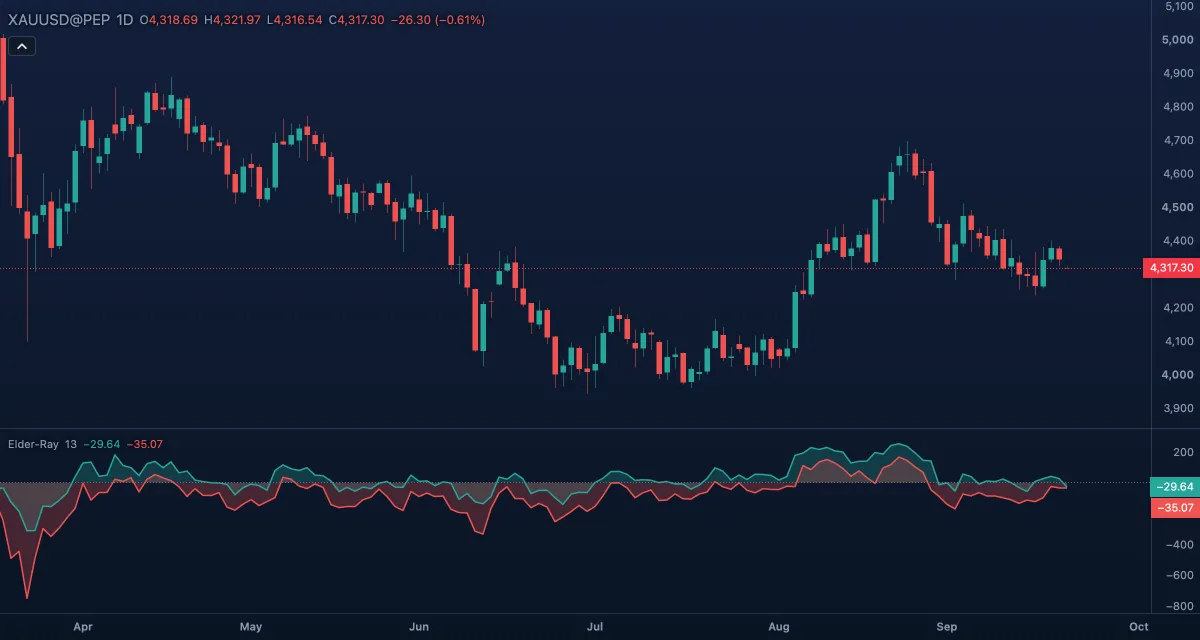 Elder-Ray (Bull and Bear Power)Elder-Ray measures how far the buyers could push the price above a 13-bar exponential moving average on each bar, and how far the sellers could push it below: bull power is the high minus the EMA, bear power the low minus the EMA.
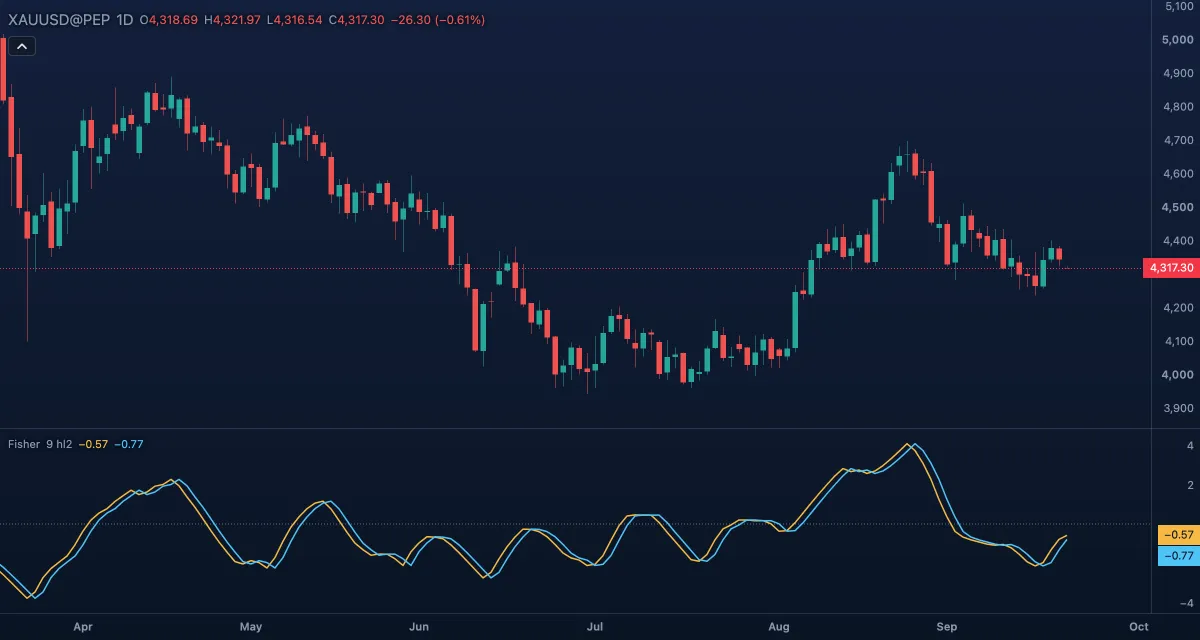 Fisher TransformThe Fisher Transform takes where the price sits inside its range of the last 9 bars and reshapes it so that extremes become sharp, clear peaks rather than the flat tops of a stochastic.
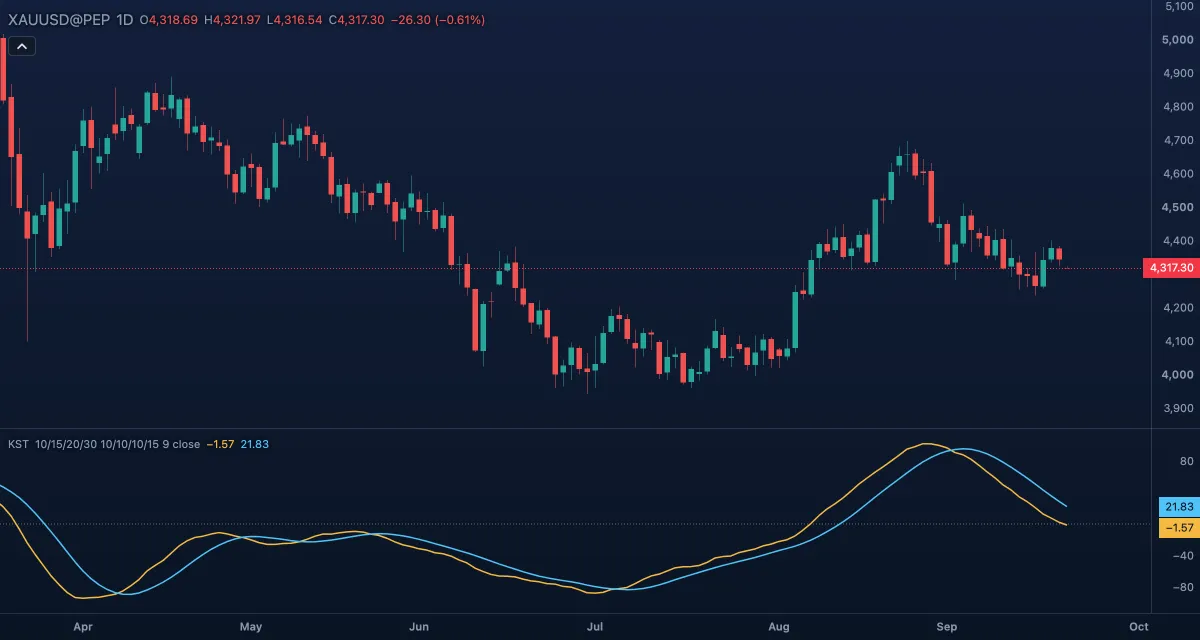 Know Sure Thing (KST)The Know Sure Thing (KST) is a momentum indicator that adds up four rates of change of different lengths, each one smoothed, so that short swings and long swings both count.
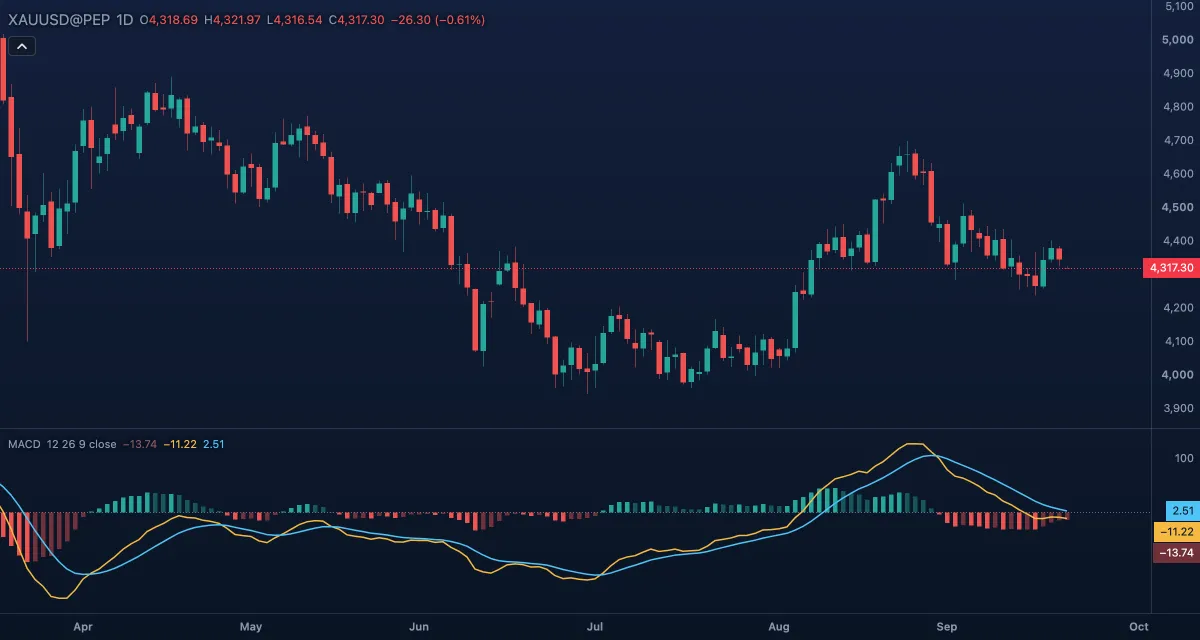 MACDMACD (moving average convergence divergence) measures the distance between a fast and a slow exponential moving average of the price.
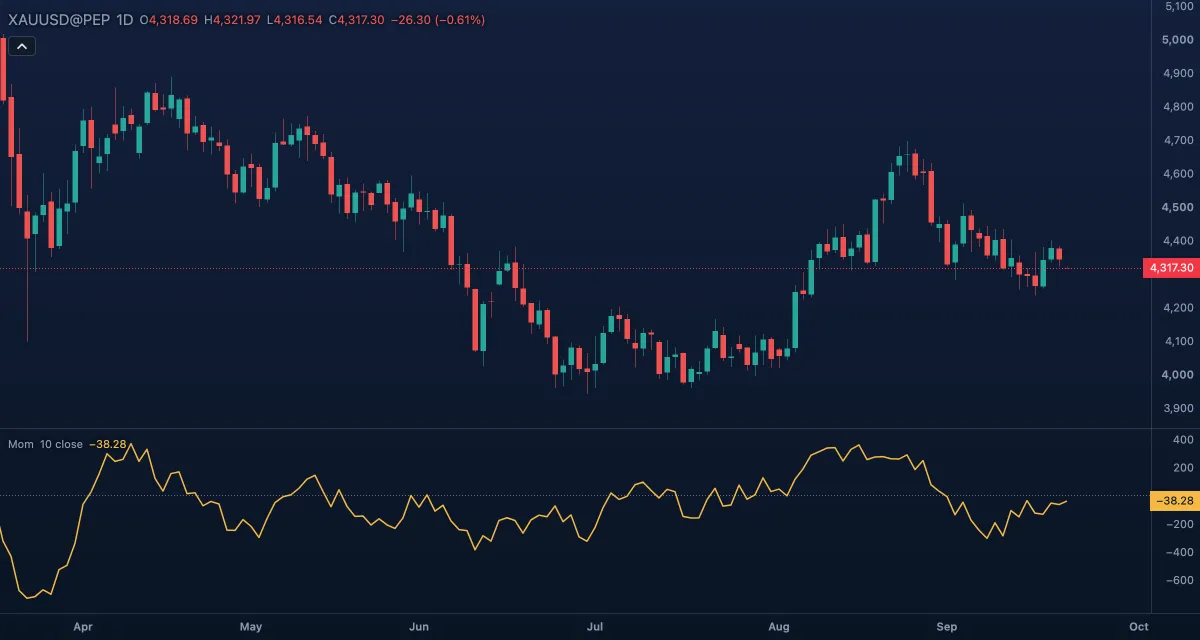 MomentumMomentum is the simplest momentum indicator: the price now minus the price a set number of bars ago.
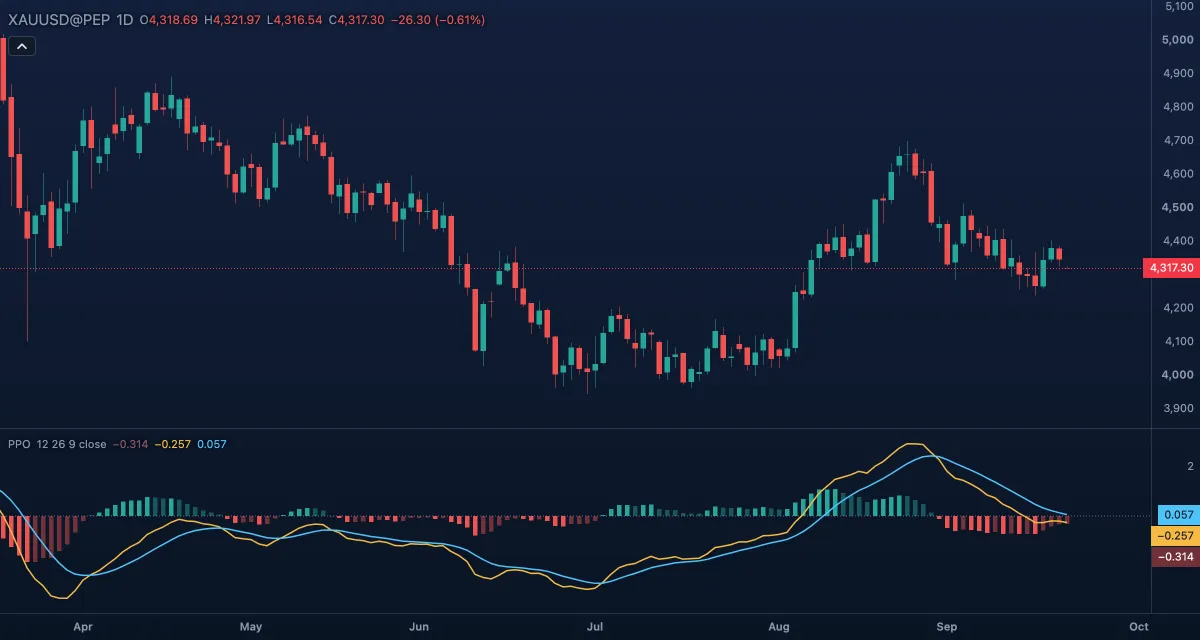 Percentage Price Oscillator (PPO)The Percentage Price Oscillator measures the gap between a fast and a slow exponential moving average as a percentage of the slow one.
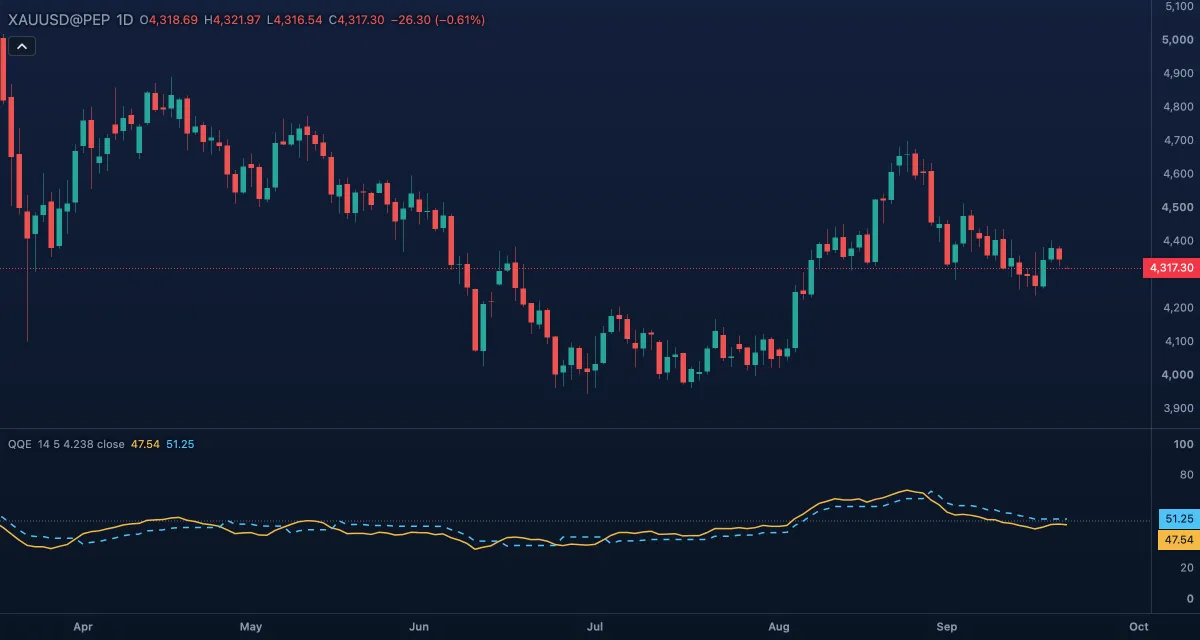 QQEQQE, short for Quantitative Qualitative Estimation, is a smoothed RSI with a trailing level that follows it like a stop: the level ratchets behind the RSI line and flips to the other side when the line crosses it.
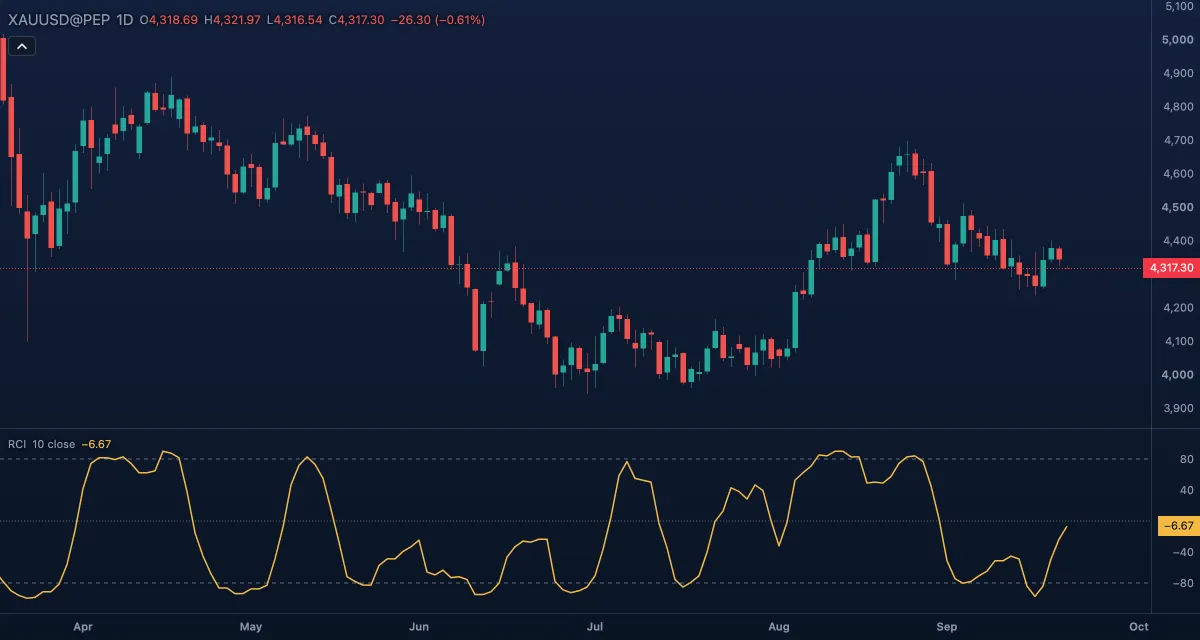 Rank Correlation Index (RCI)The Rank Correlation Index (RCI) asks one question of the last bars: how steadily has price gone up or down?
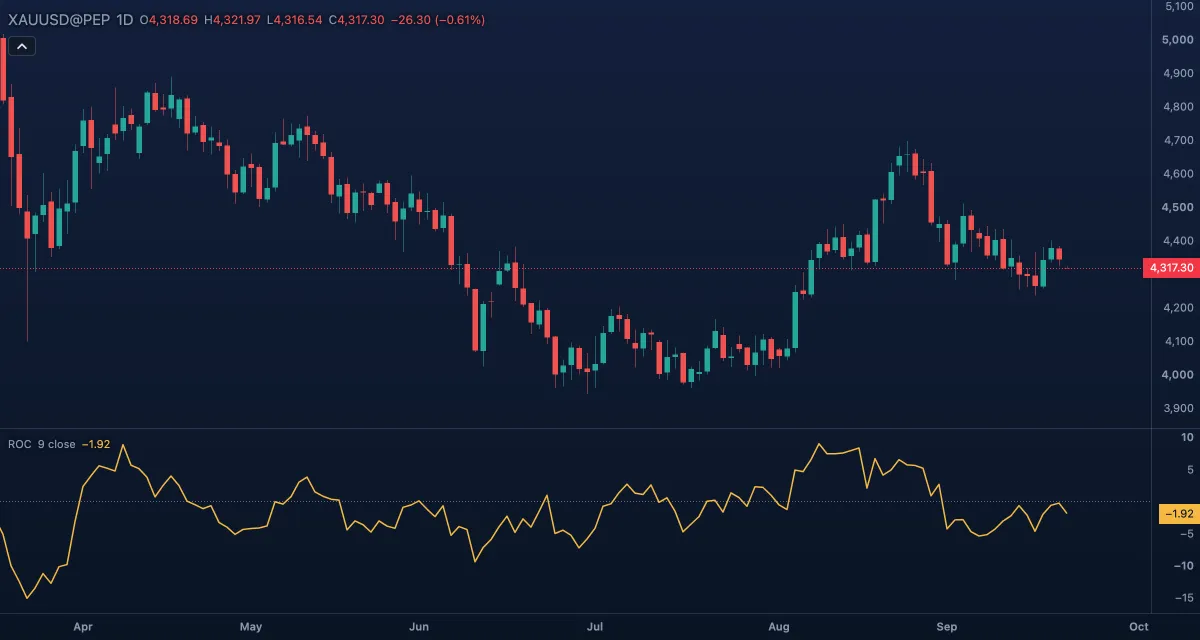 Rate of Change (ROC)The Rate of Change measures how much the price has moved over a set number of bars, in percent.
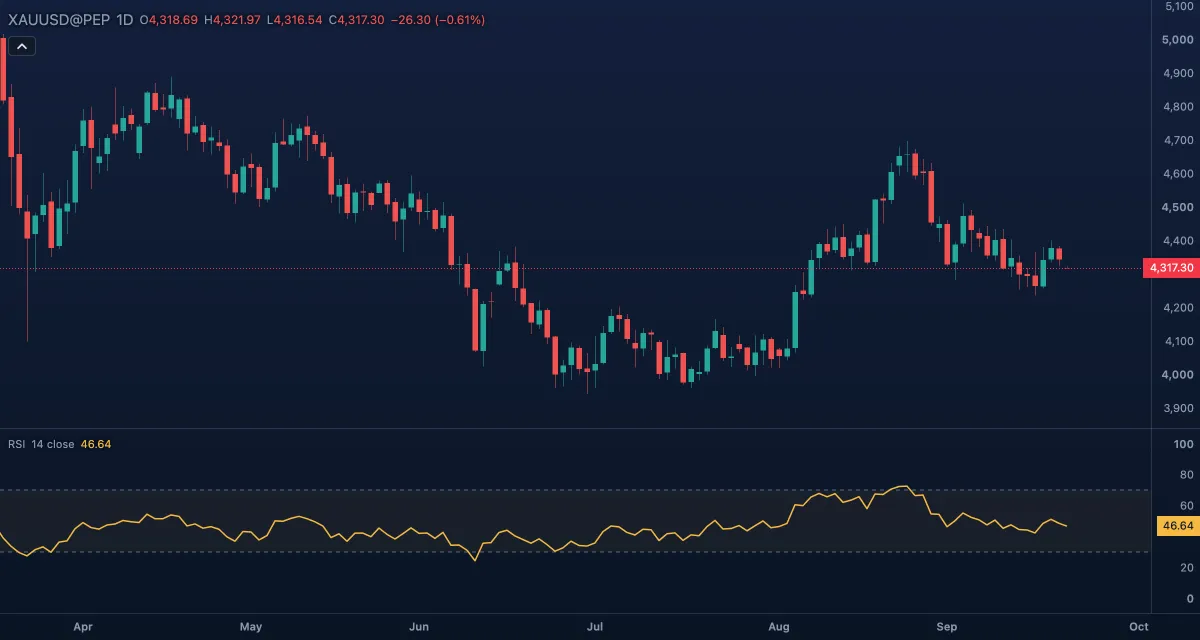 Relative Strength Index (RSI)The Relative Strength Index compares the size of recent up moves with the size of recent down moves and turns the result into a number between 0 and 100.
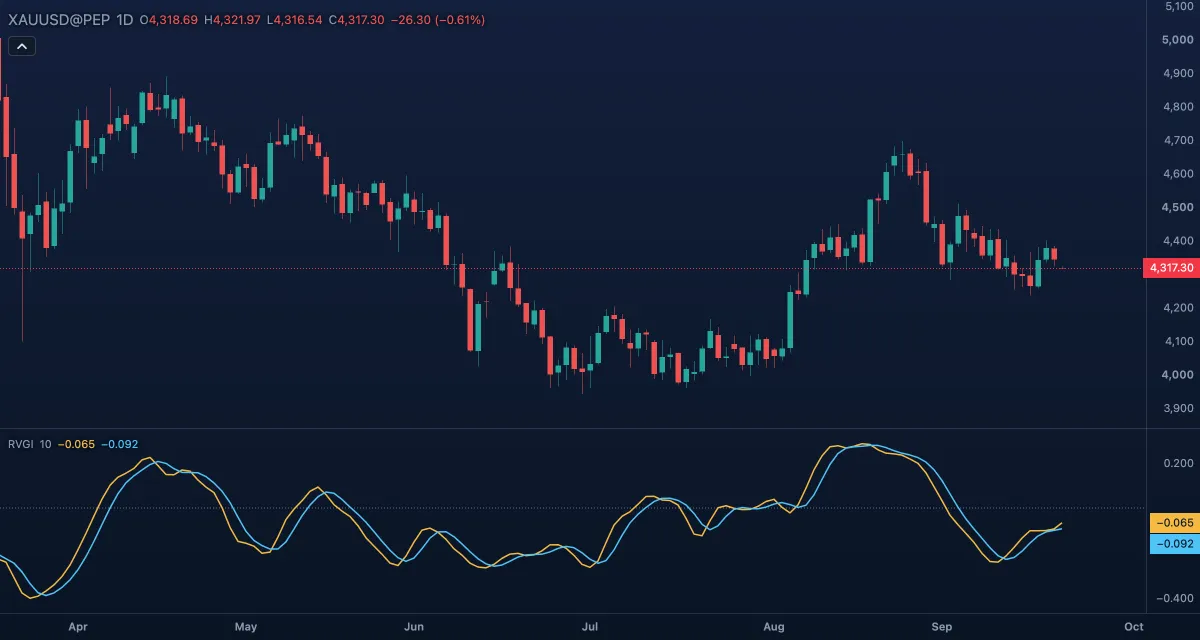 Relative Vigor Index (RVGI)The Relative Vigor Index (RVGI) compares where candles close with where they open, against how much they range: in a rising market candles tend to close above their open, in a falling one below.
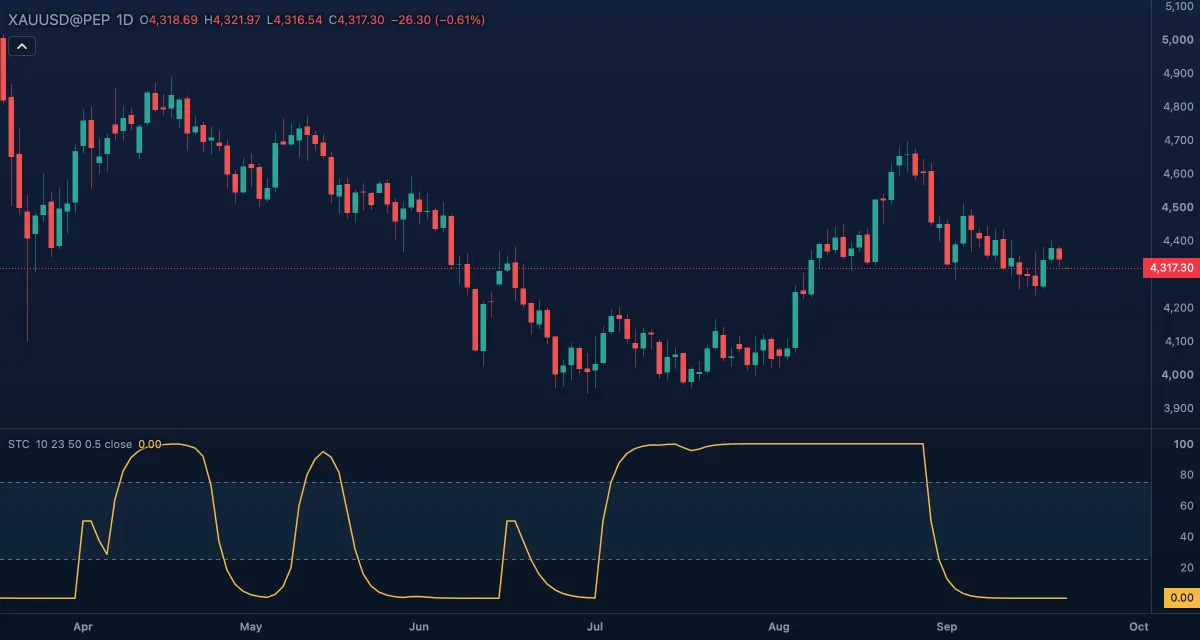 Schaff Trend Cycle (STC)The Schaff Trend Cycle (STC) is a faster, smoother reading of MACD: it runs the MACD line through a stochastic twice, so the result swings between 0 and 100 and turns early when a trend starts or ends.
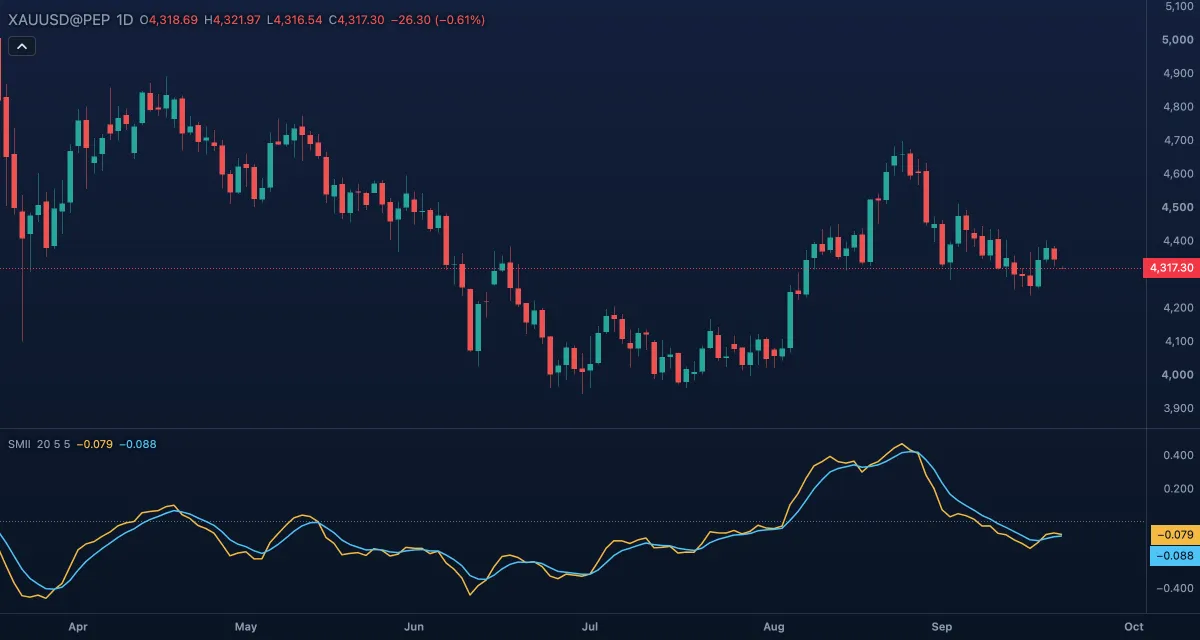 SMI Ergodic Indicator (SMII)The SMI Ergodic Indicator (SMII) is William Blau's True Strength Index drawn as a ratio: double-smoothed price change divided by double-smoothed absolute price change, between −1 and +1, with an exponential signal line.
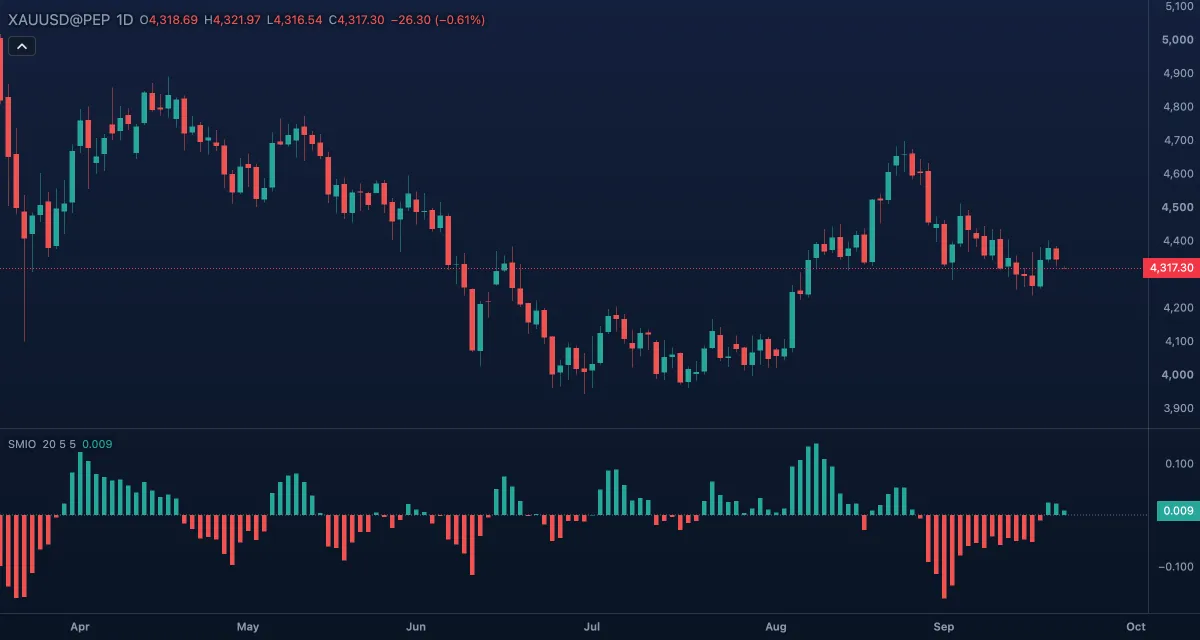 SMI Ergodic Oscillator (SMIO)The SMI Ergodic Oscillator (SMIO) is the gap between the two lines of the SMI Ergodic Indicator — the SMI minus its signal line — drawn as a histogram around zero.
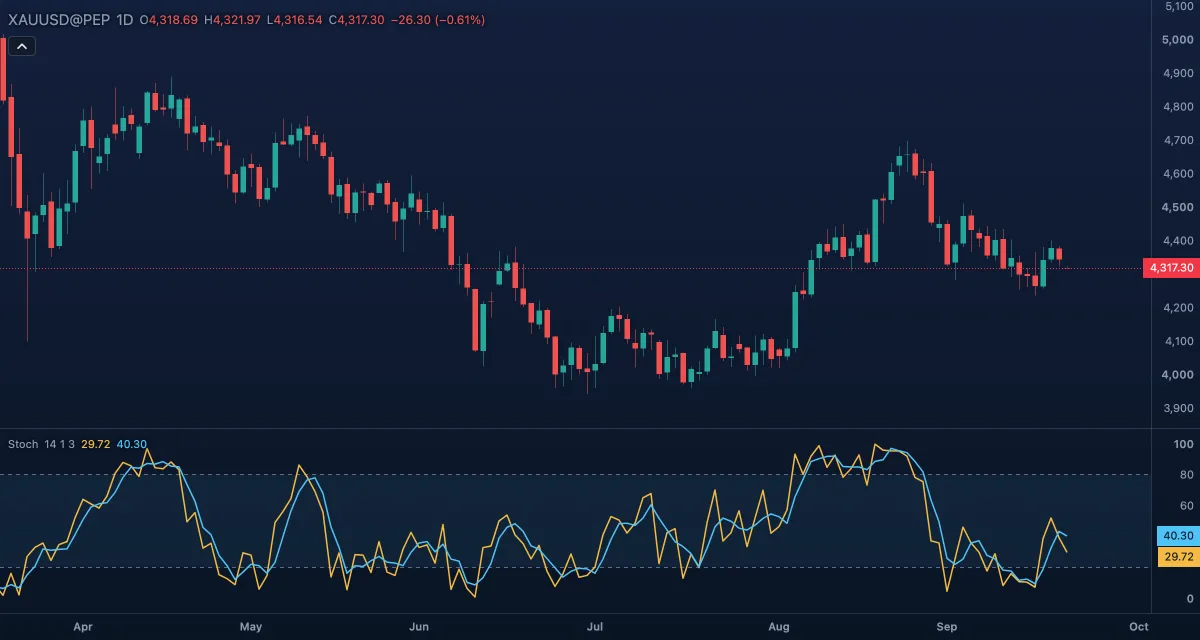 StochasticThe stochastic oscillator shows where the latest close sits inside the range of the last bars: 100 means the close is at the top of that range, 0 at the bottom.
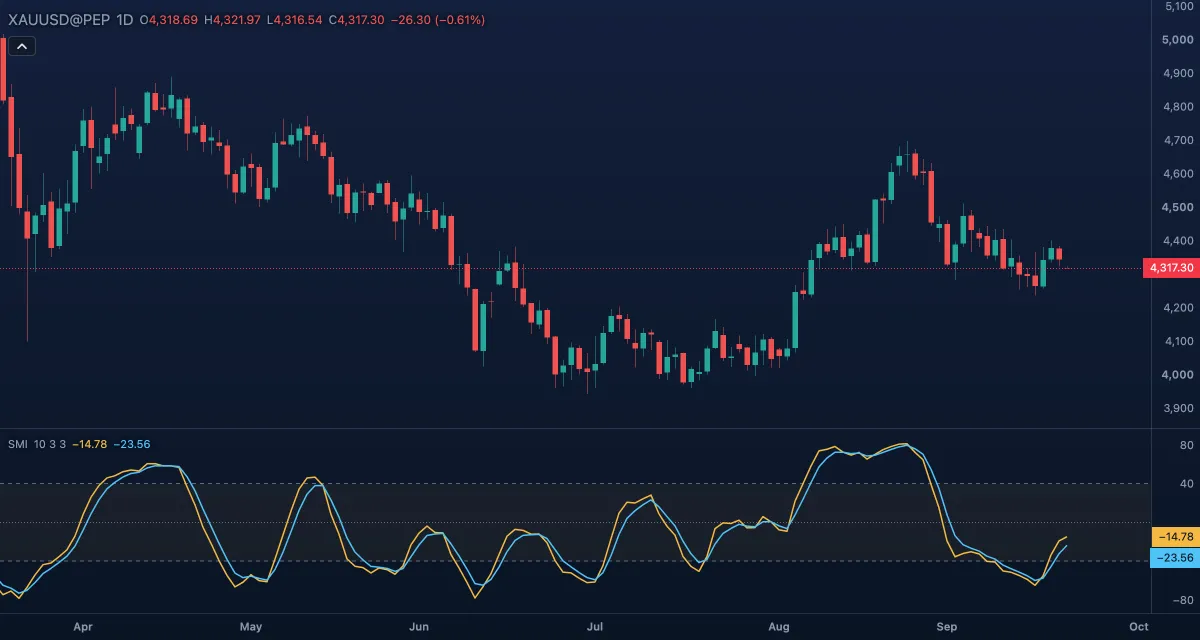 Stochastic Momentum Index (SMI)The Stochastic Momentum Index (SMI) is a refinement of the Stochastic: instead of asking where the close sits between the low and the high of the last bars, it measures the close's distance from the middle of that range, smoothed twice.
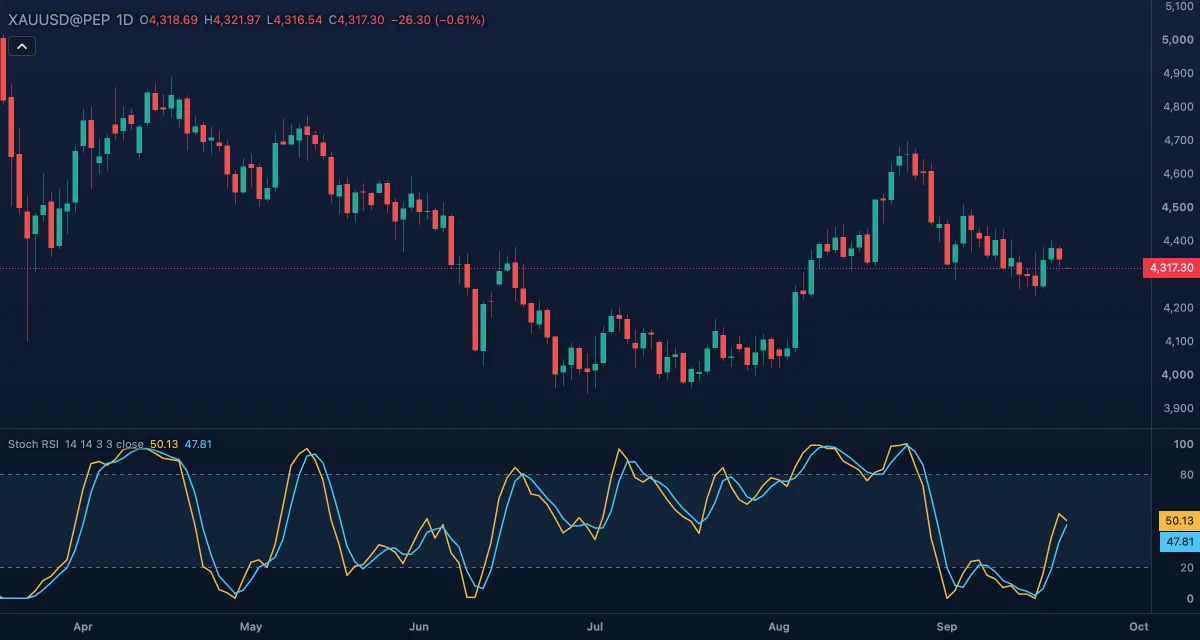 Stochastic RSI (Stoch RSI)Stochastic RSI applies the stochastic formula to the RSI instead of to the price: it shows where the RSI sits inside its own recent range, from 0 at the lowest RSI of the window to 100 at the highest.
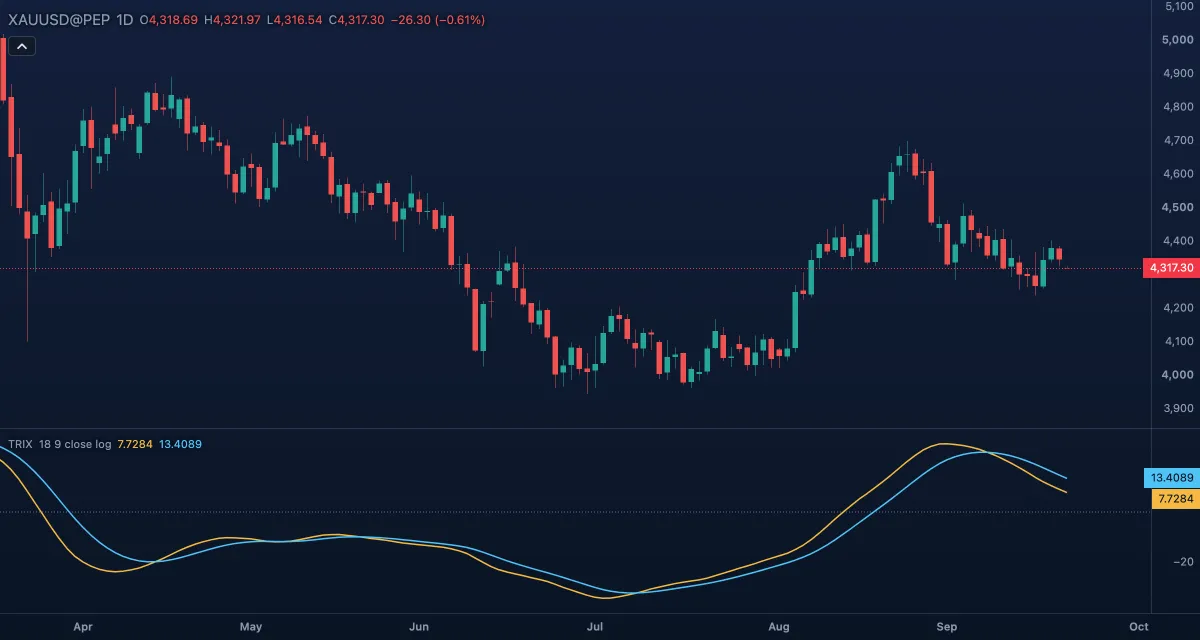 TRIXTRIX is the bar-to-bar change of a triple-smoothed exponential moving average.
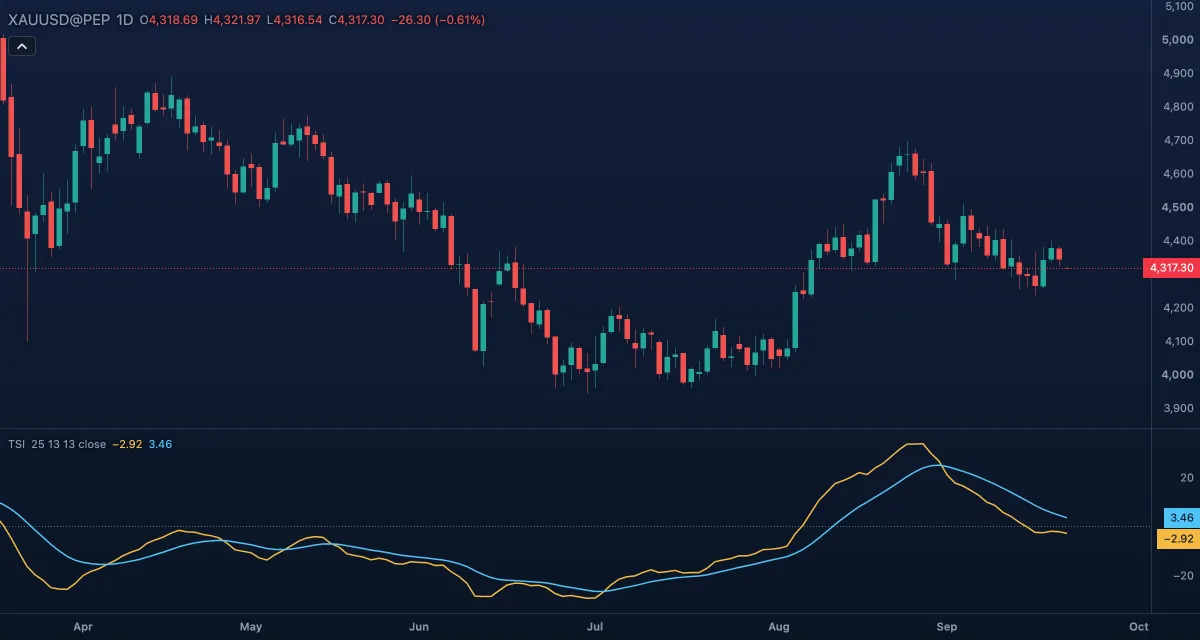 True Strength Index (TSI)The True Strength Index (TSI) is a momentum oscillator built from bar-to-bar price changes, smoothed twice with exponential moving averages so that it follows the trend with little noise.
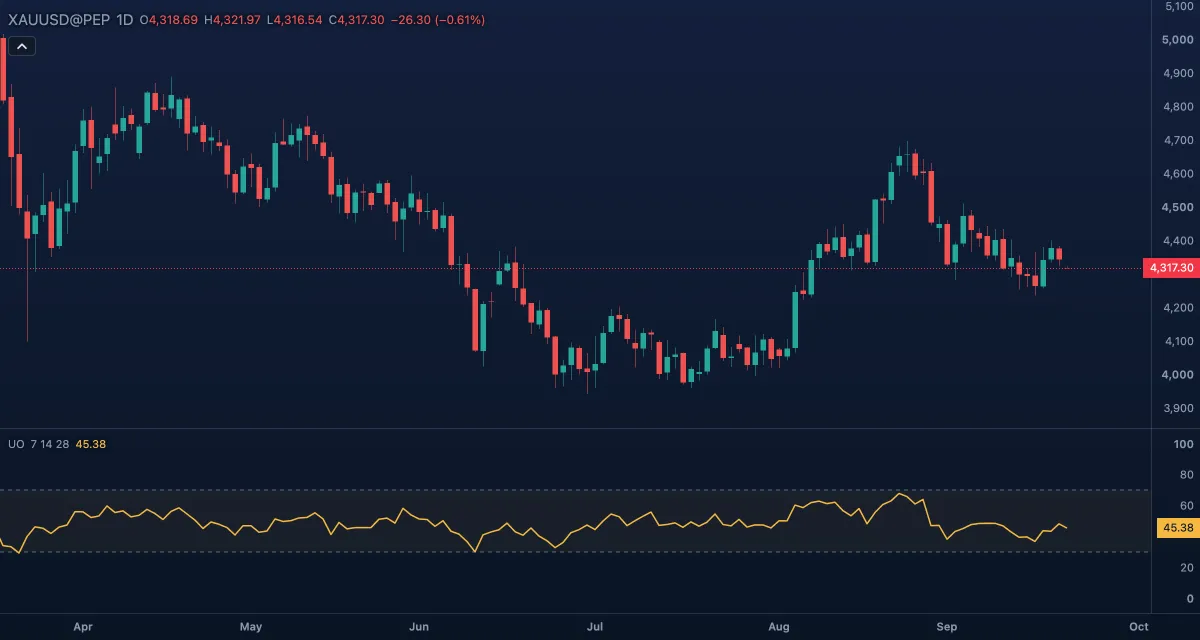 Ultimate Oscillator (UO)The Ultimate Oscillator measures buying pressure, how far each close sits above the bar's true low, as a share of the true range, over three windows at once: 7, 14 and 28 bars, weighted 4, 2 and 1.
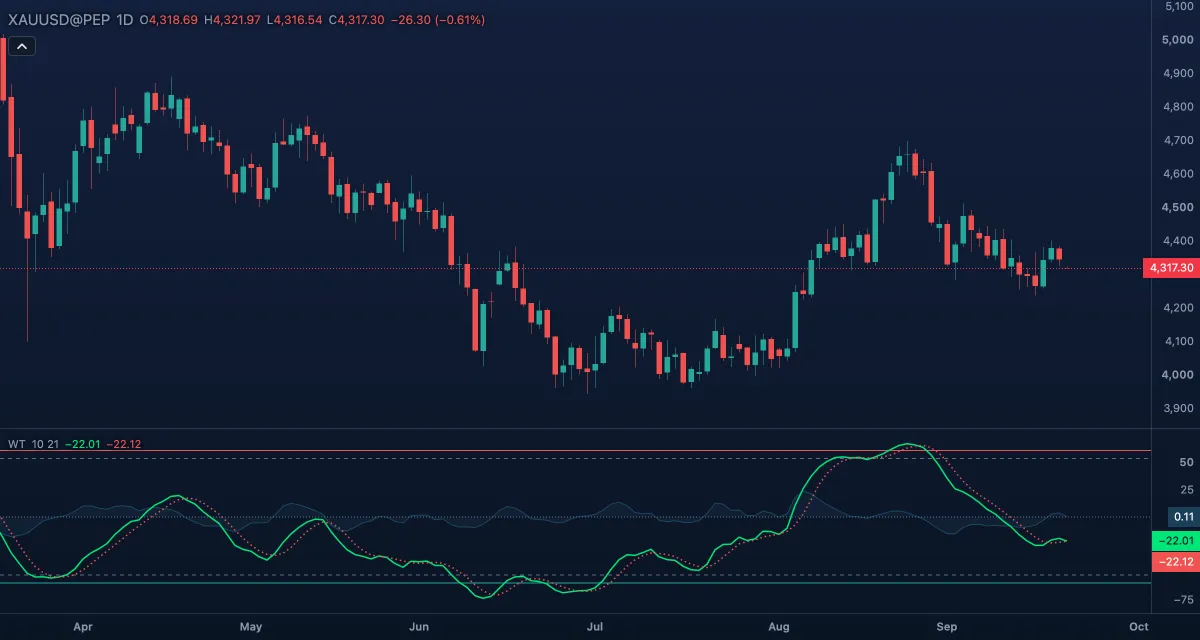 WaveTrend (WT)WaveTrend is a smoothed oscillator of the typical price — a channel index in the spirit of the CCI, passed through two moving averages — drawn as two lines whose crossings near the overbought and oversold levels are the signals.
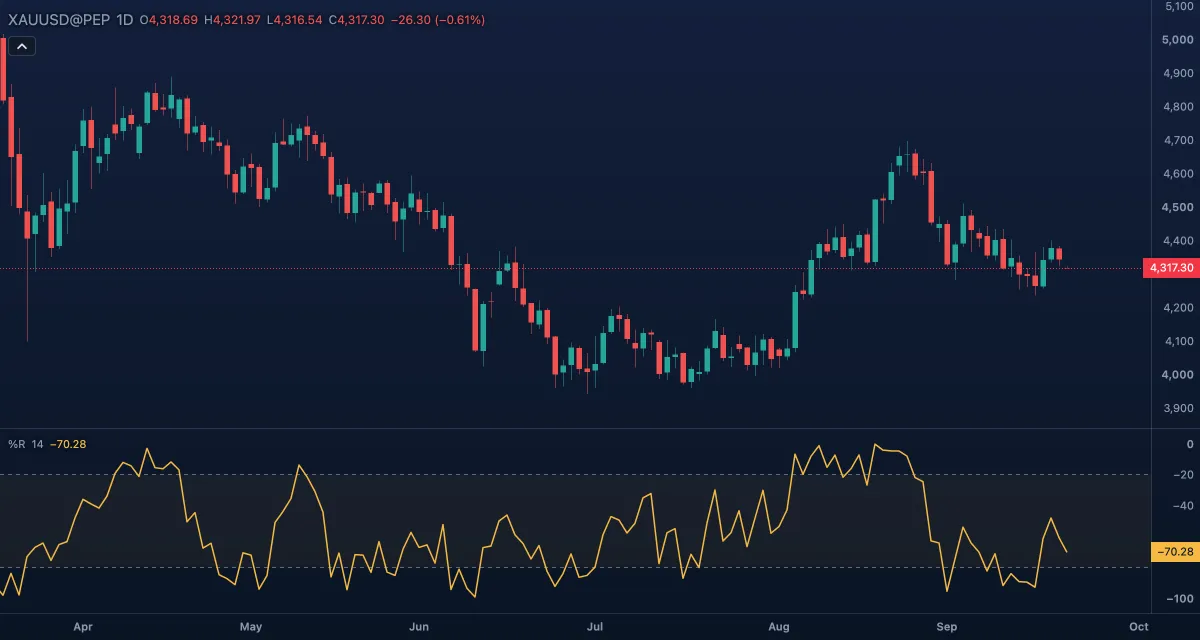 Williams %RWilliams %R shows where the latest close sits inside the range of the last 14 bars, read from the top: 0 when the close is at the highest high of the window, −100 when it is at the lowest low.
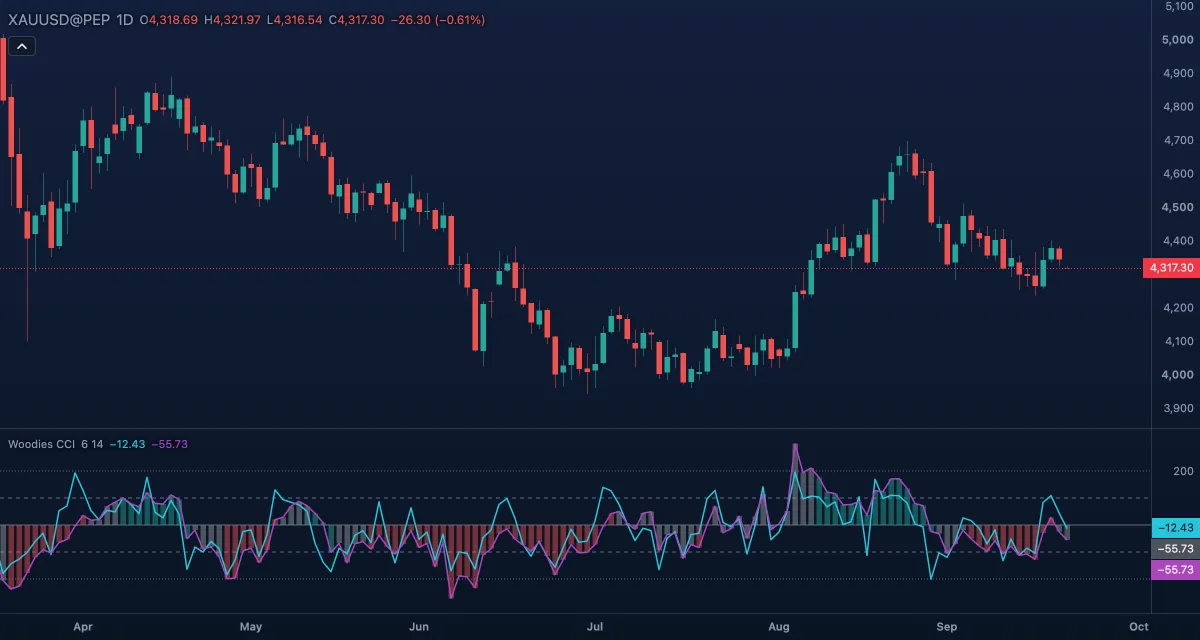 Woodies CCIWoodies CCI is Ken Wood's way of reading the Commodity Channel Index (CCI): a 14-bar CCI drawn as a line and as a histogram, a faster 6-bar "turbo" CCI, and a histogram colour that calls the trend only after the CCI has held one side of zero for five bars.
Volatility#
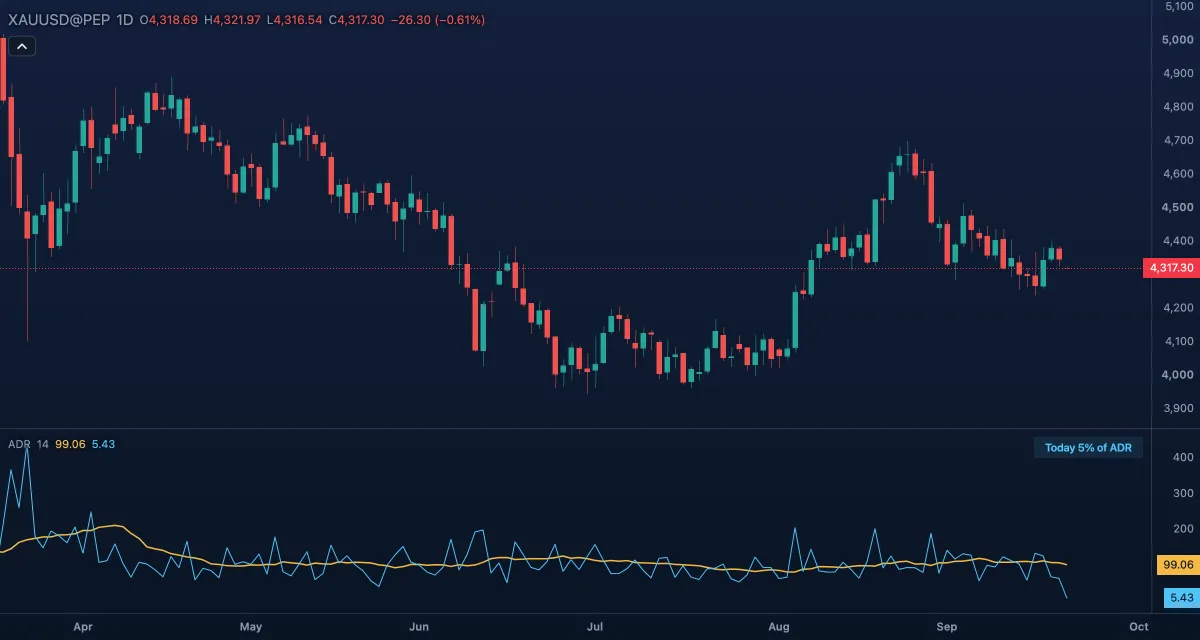 Average Day Range (ADR)The Average Day Range is the average distance between a day's high and its low over the last N days, in the symbol's price units, with the range today has covered so far drawn next to it.
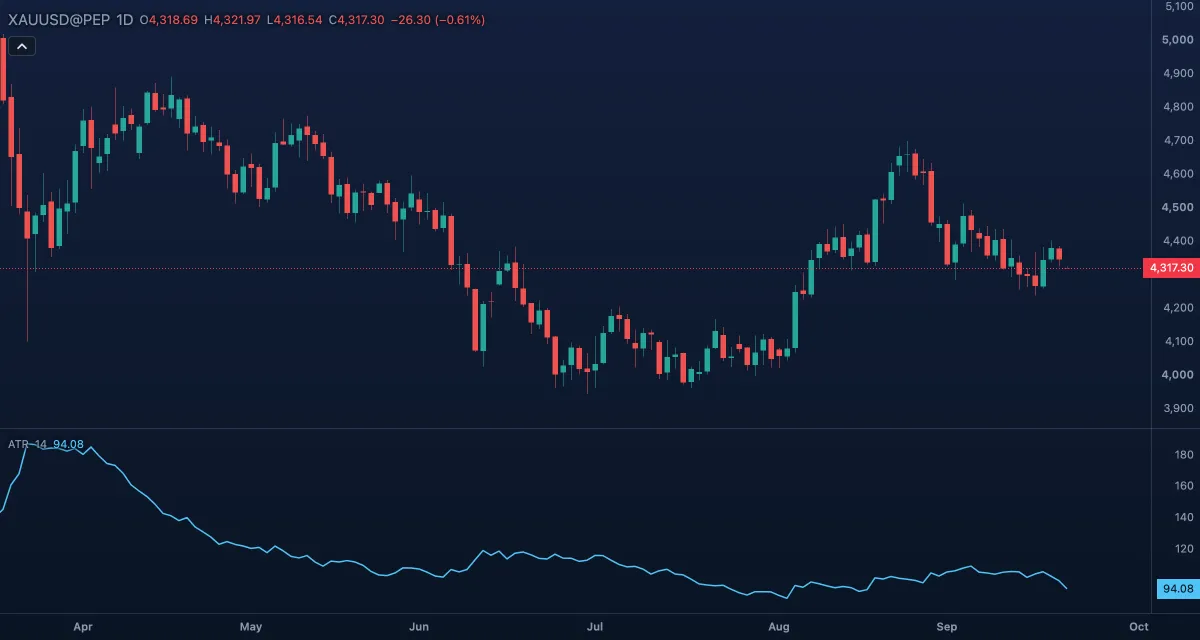 Average True Range (ATR)The Average True Range measures how far the price moves in a bar, on average, in the symbol's own price units: dollars for gold.
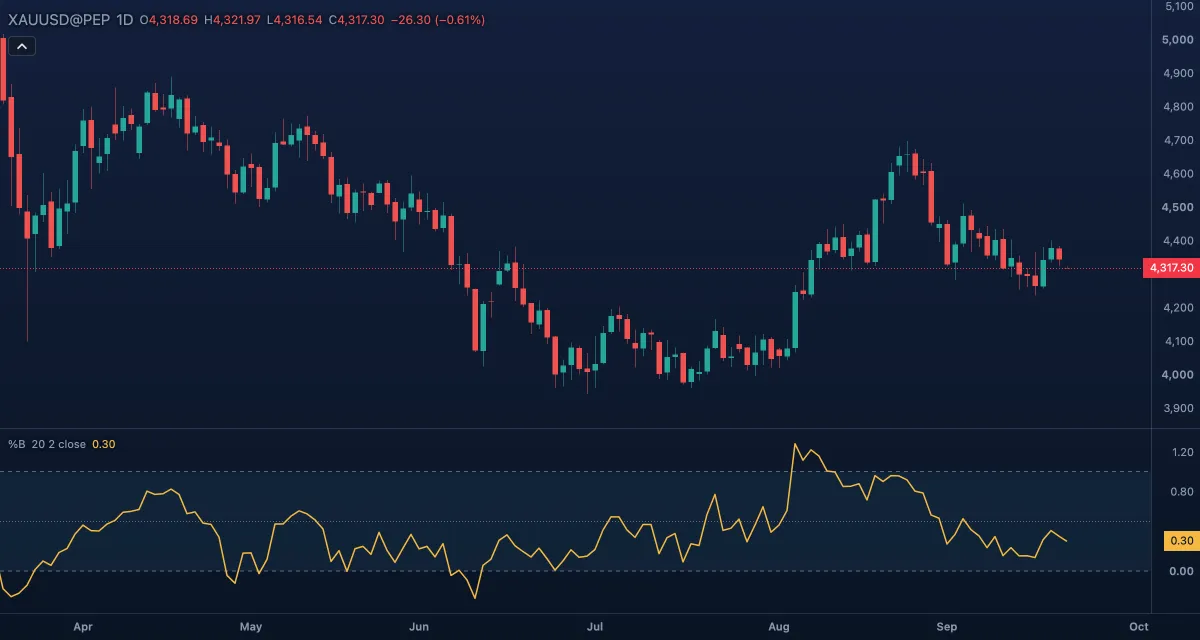 Bollinger %BBollinger %B tells you where the price sits inside the Bollinger Bands, as one number: 1 on the upper band, 0.5 on the basis, 0 on the lower band, and above 1 or below 0 when the price is outside the bands.
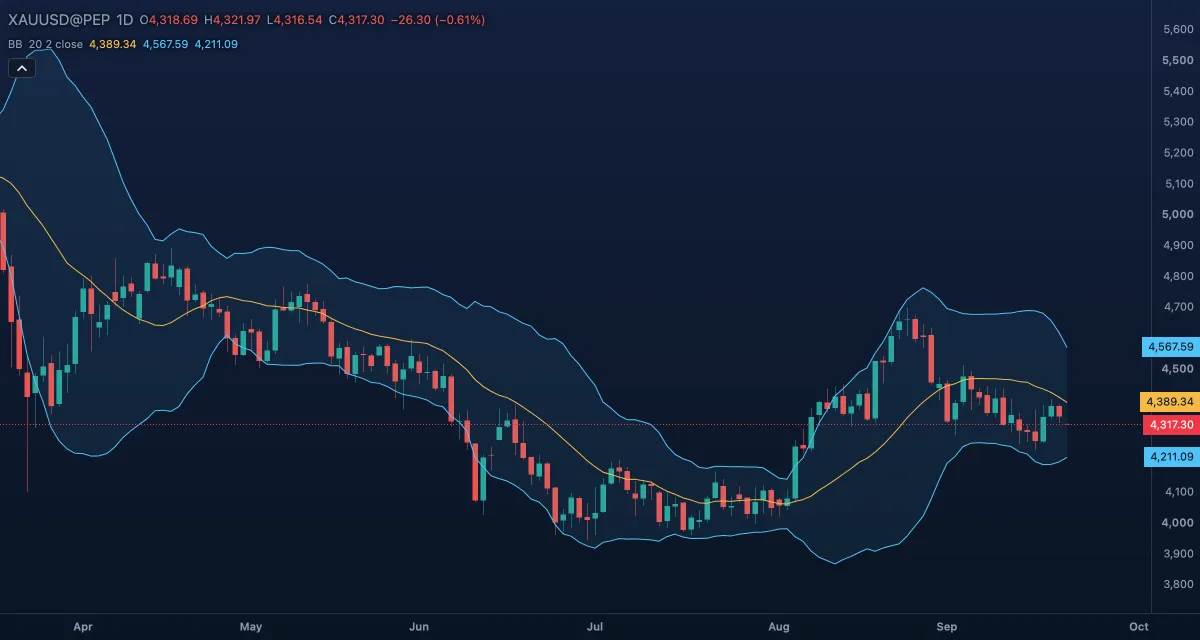 Bollinger Bands (BB)Bollinger Bands draw a moving average with a band on each side, a set number of standard deviations away.
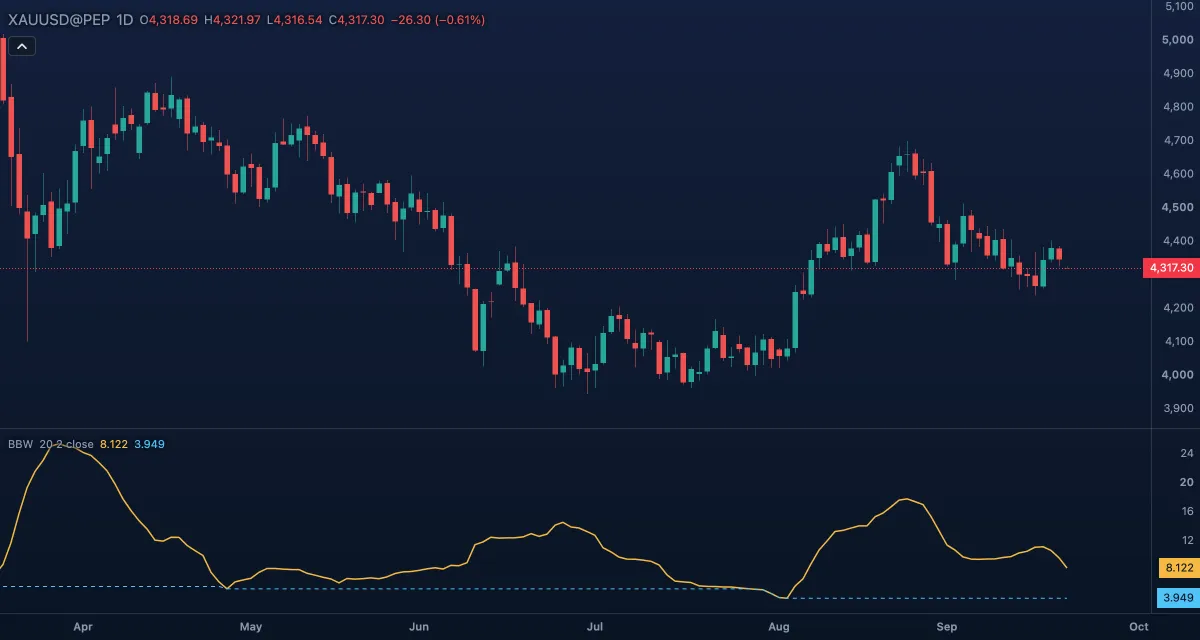 Bollinger BandWidth (BBW)Bollinger BandWidth measures how wide the Bollinger Bands are, as a percentage of their middle line.
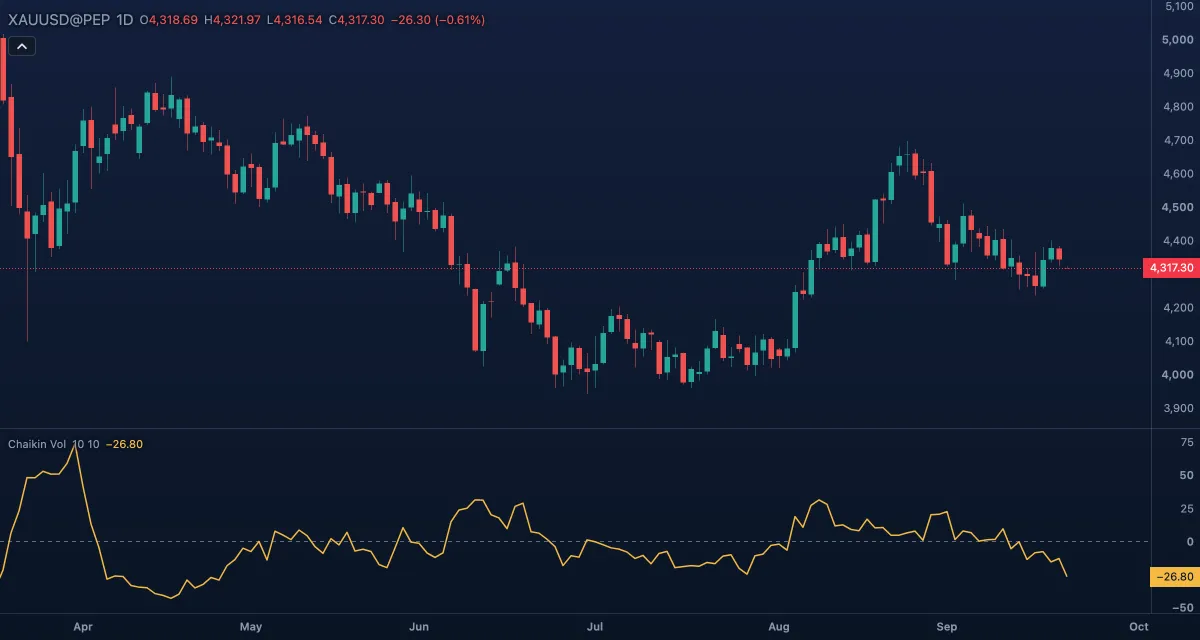 Chaikin VolatilityChaikin Volatility measures how fast the size of the candles is changing.
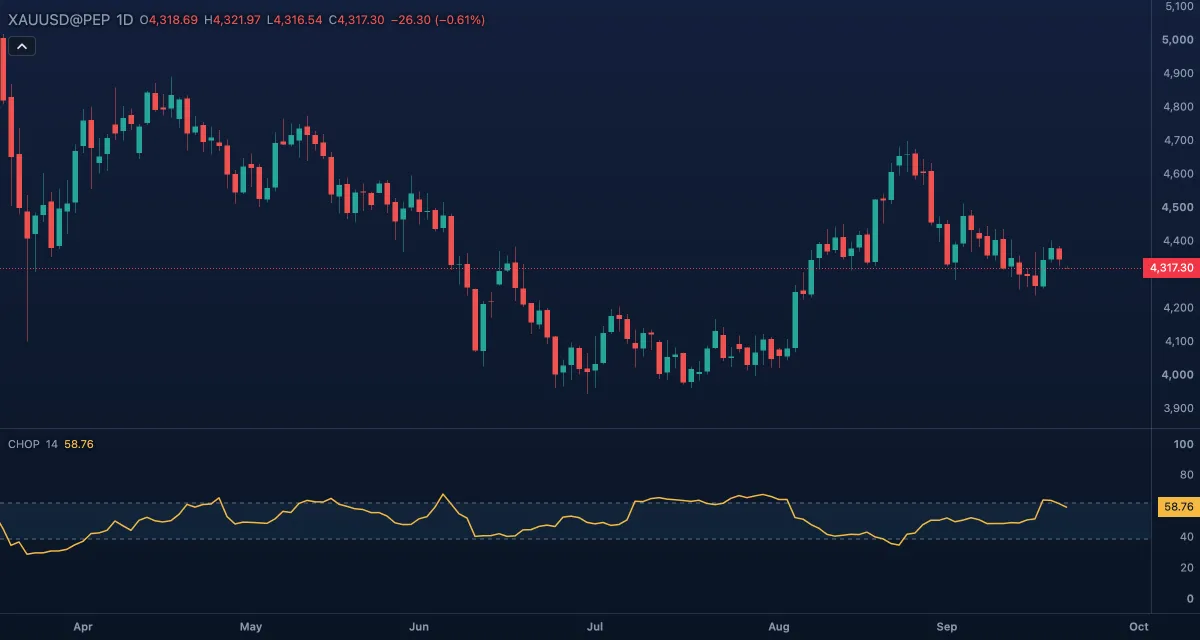 Choppiness Index (CHOP)The Choppiness Index tells you whether the market is trending or chopping sideways, on a scale from 0 to 100: high means the bars overlap and the price goes nowhere, low means each bar extends the move.
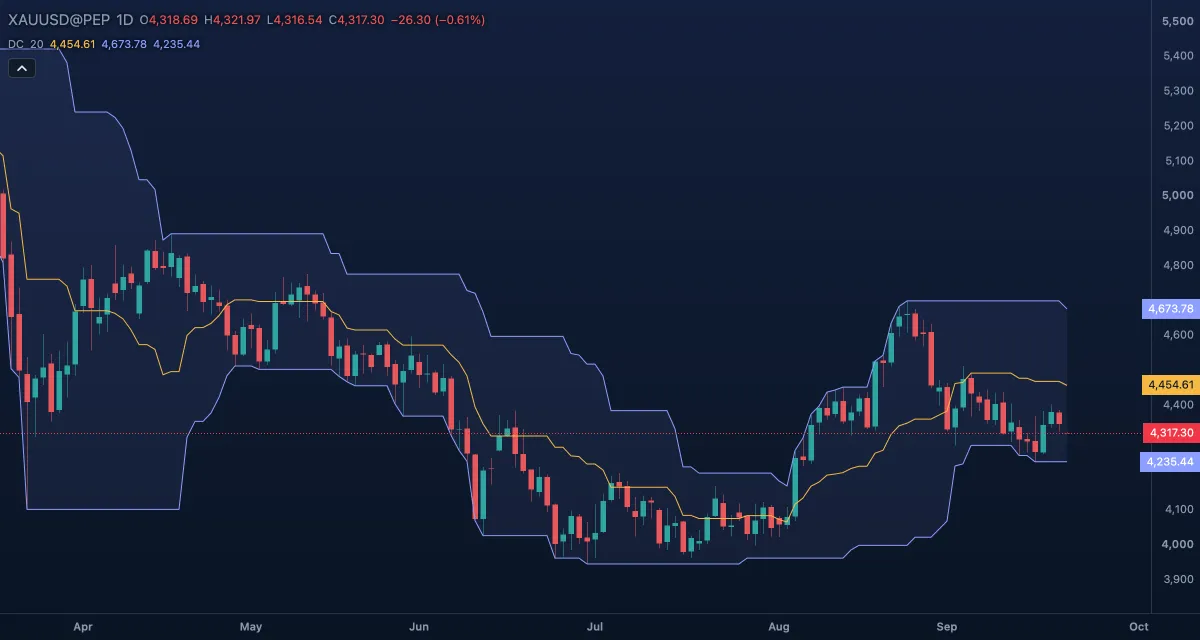 Donchian Channels (DC)Donchian Channels draw the highest high and the lowest low of the last N bars, and the line half-way between them, over the candles.
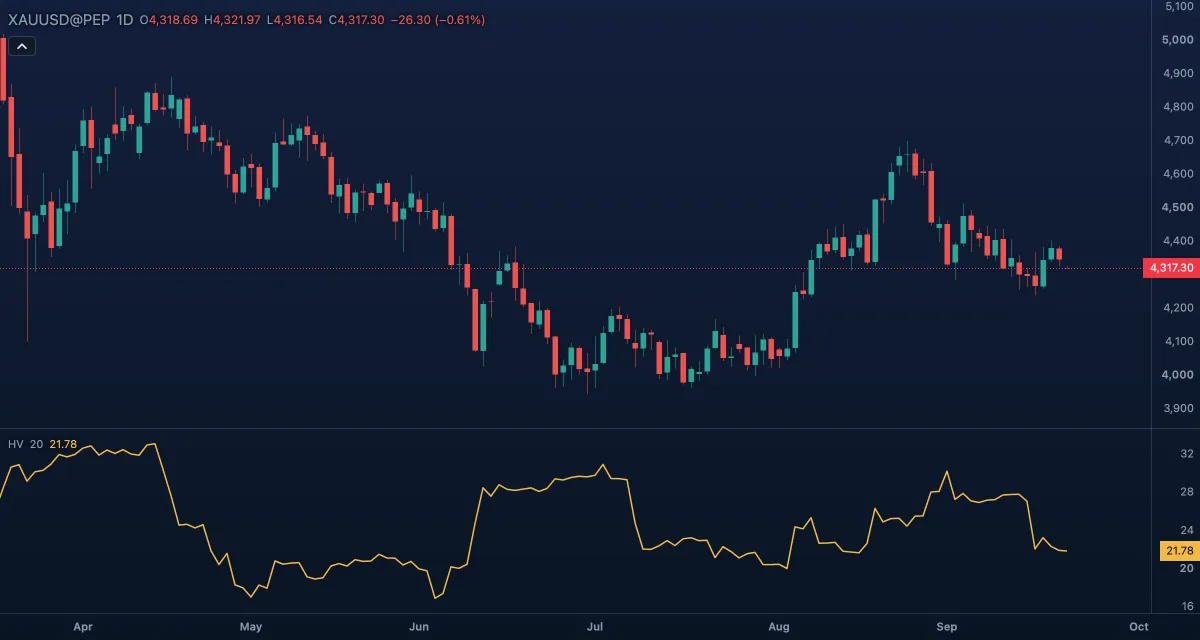 Historical Volatility (HV)Historical volatility (also called realised or statistical volatility) measures how much the close has moved from bar to bar over a recent window, scaled up to a yearly figure in percent.
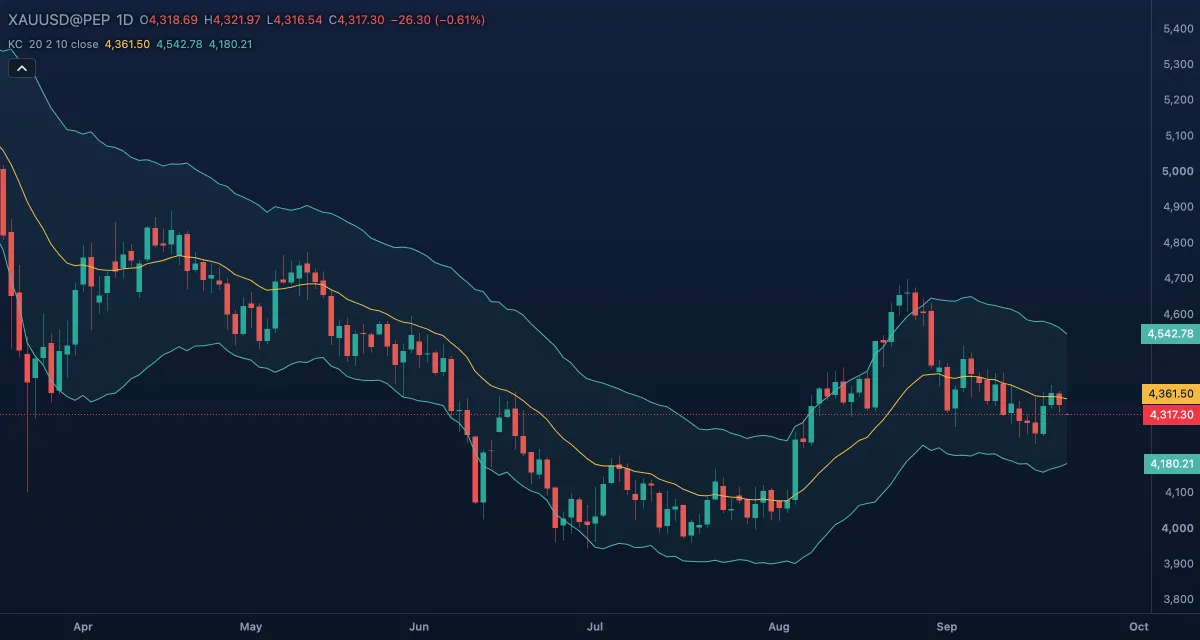 Keltner Channels (KC)Keltner Channels draw an exponential moving average with a band on each side a multiple of the Average True Range away, so the channel's width follows the size of the market's own bars.
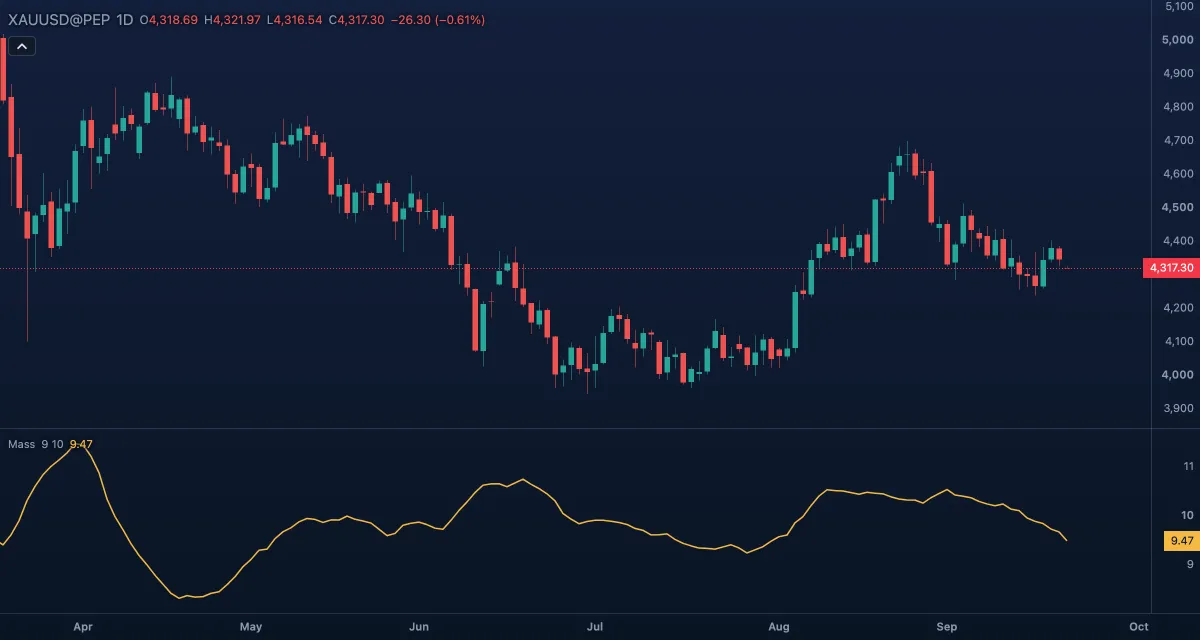 Mass IndexThe Mass Index looks for a coming reversal by watching how the distance between each bar's high and low widens and narrows.
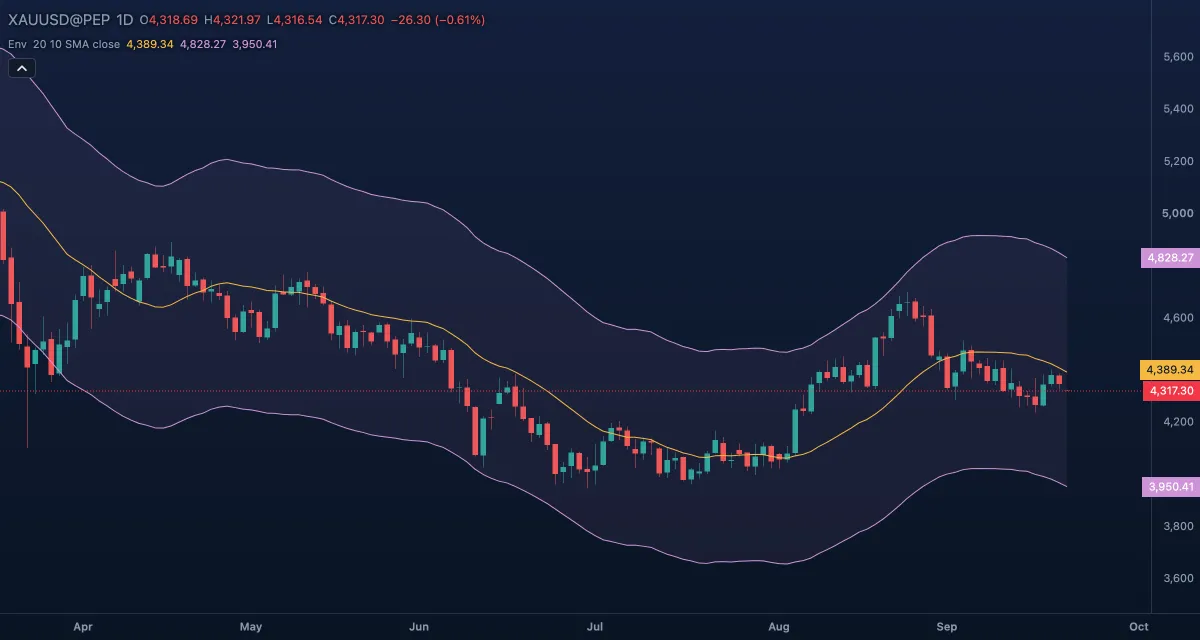 Moving Average Envelopes (Env)Moving Average Envelopes draw two lines a fixed percentage above and below a moving average, over the candles.
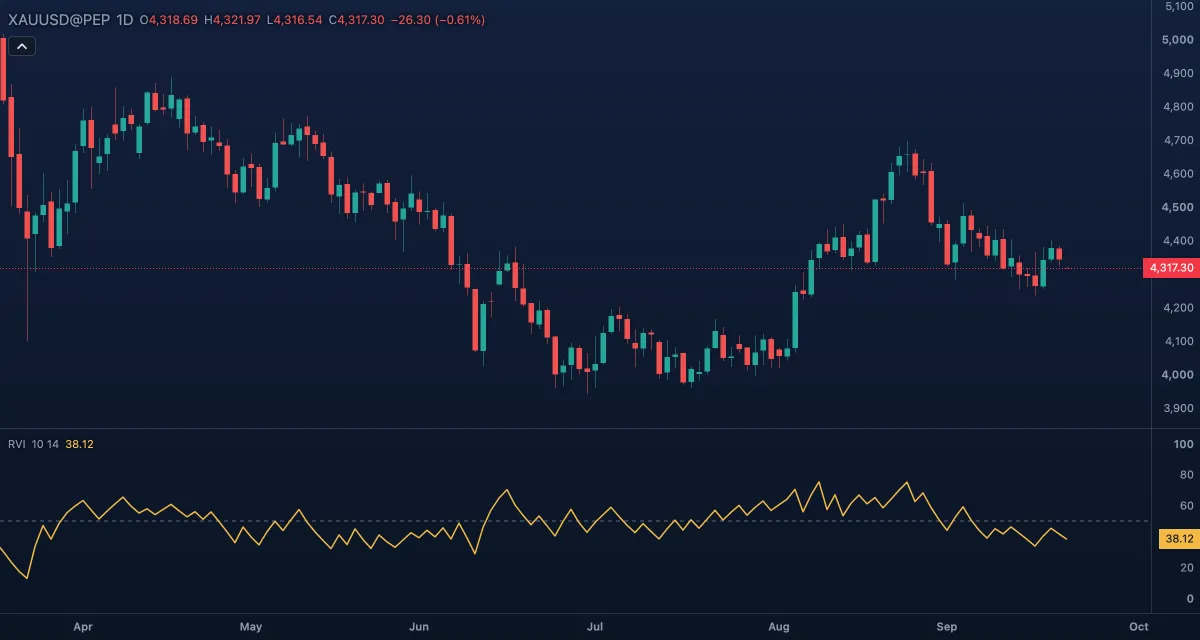 Relative Volatility Index (RVI)The Relative Volatility Index measures the direction of volatility: whether the recent standard deviation of price has been building on bars that closed up or on bars that closed down.
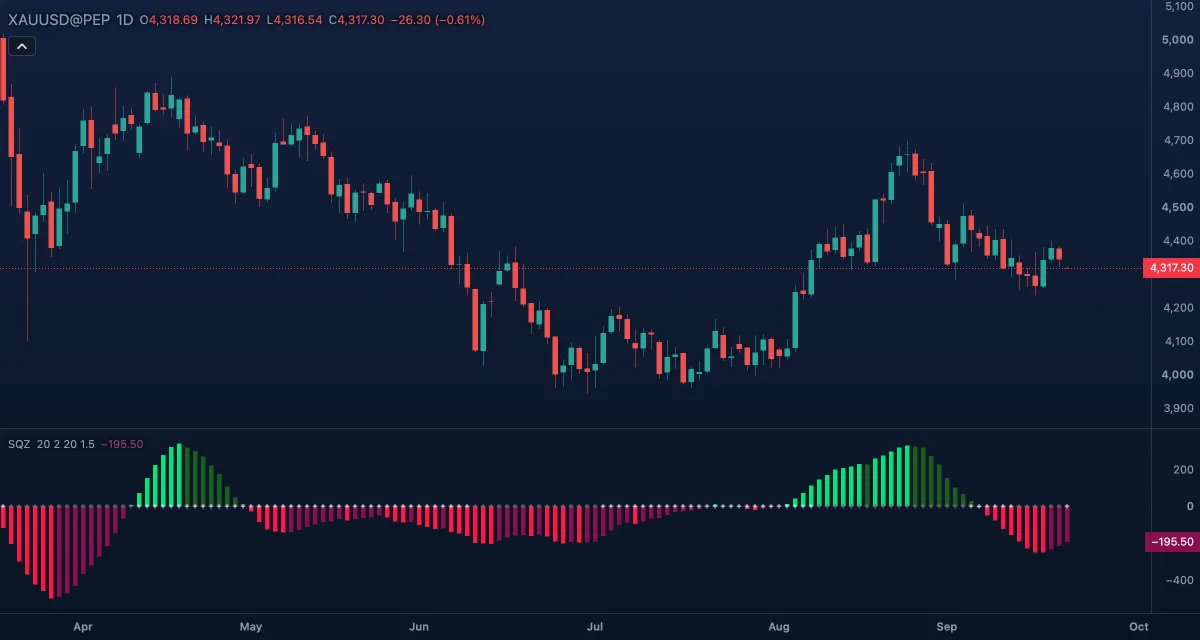 Squeeze Momentum (SQZ)Squeeze Momentum marks the bars on which the Bollinger Bands have contracted inside the Keltner Channel — a "squeeze", the market coiling before a move — and draws a momentum histogram to read which way the move leans when the squeeze releases.
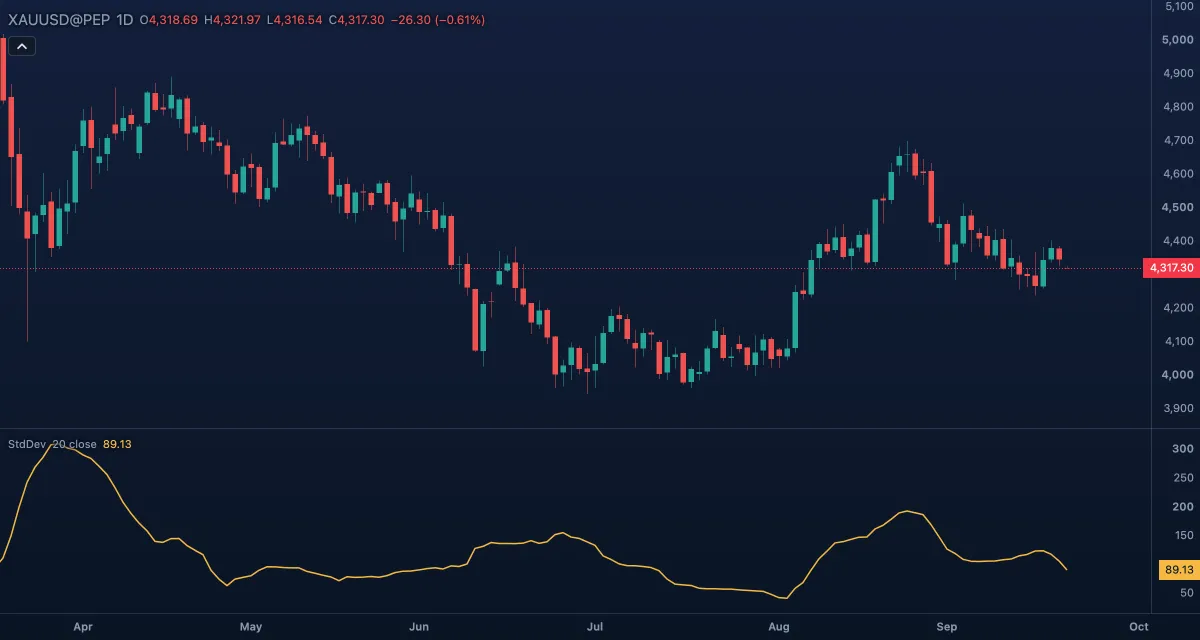 Standard Deviation (StdDev)Standard deviation measures how far the price has been spreading around its own average over a recent window.
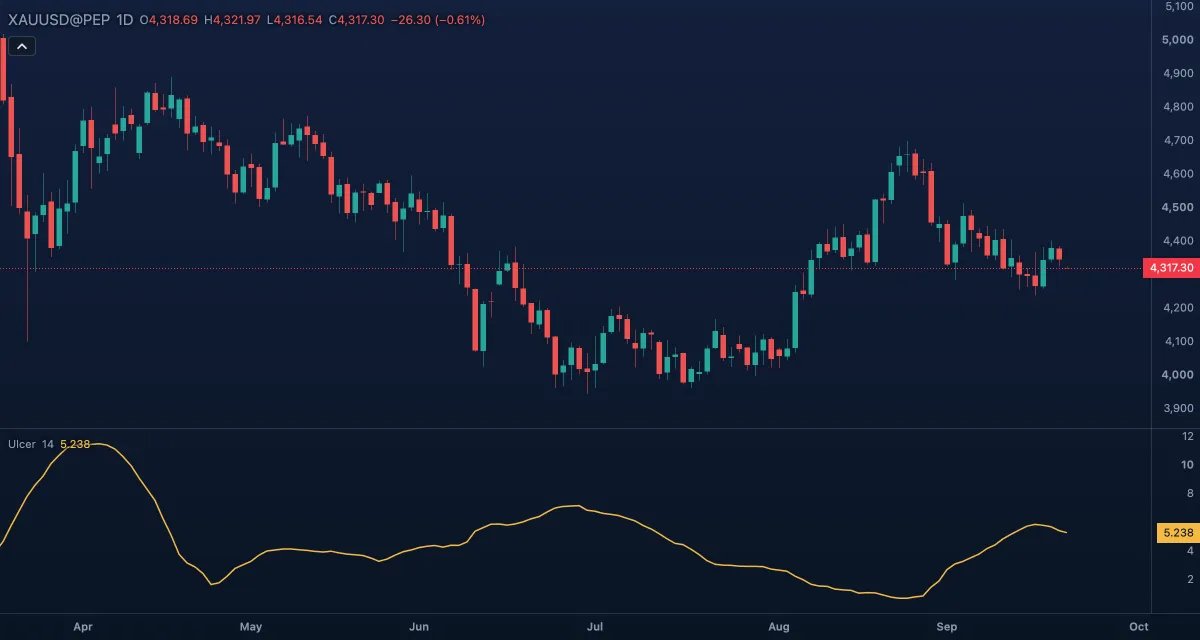 Ulcer IndexThe Ulcer Index measures the pain of holding a position: how far, and for how long, the price has sat below its recent high.
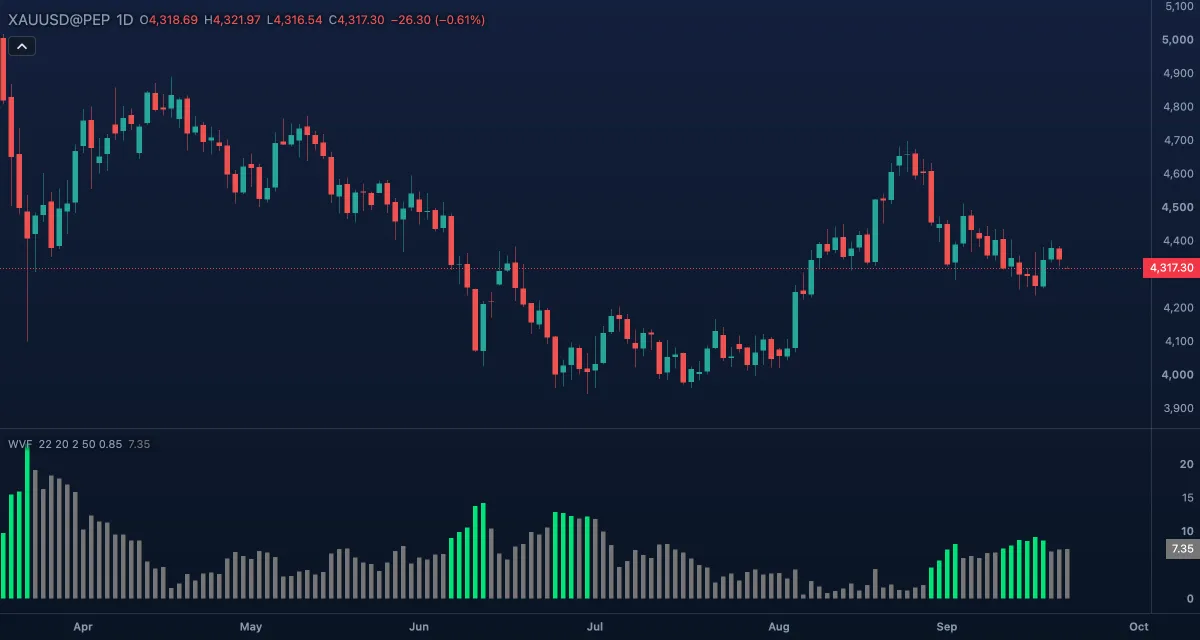 Williams Vix Fix (WVF)The Williams Vix Fix rebuilds the idea of the VIX, the fear gauge of the US stock market, from a symbol's own prices, so it works on gold, forex or crypto, where there is no options market to read fear from.
Volume#
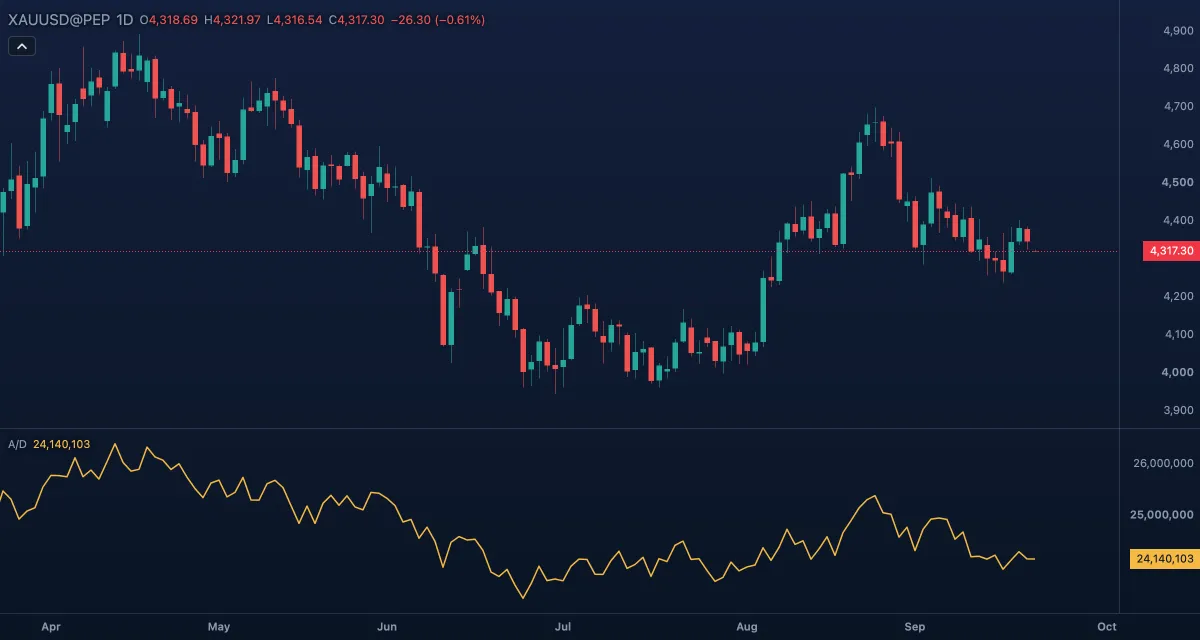 Accumulation/Distribution Line (A/D)The Accumulation/Distribution Line adds up each candle's volume weighted by where the candle closed inside its range: a close near the high counts as accumulation (buying), a close near the low as distribution (selling).
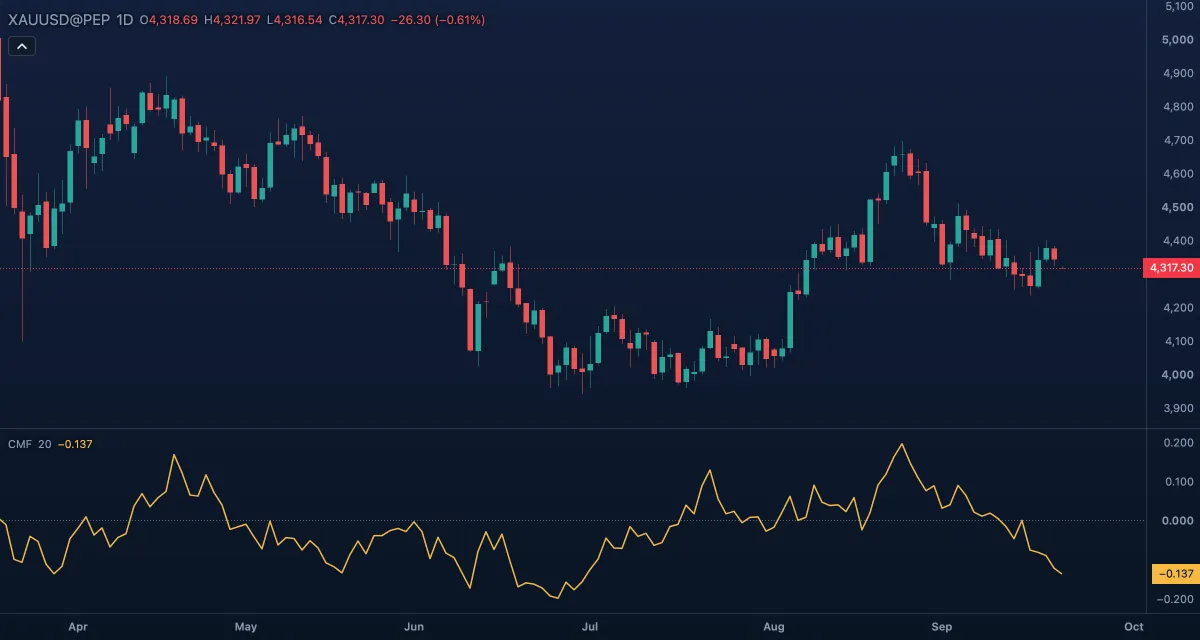 Chaikin Money Flow (CMF)Chaikin Money Flow measures buying and selling pressure over a window of candles: the volume of the last 20 candles, weighted by where each candle closed in its range, divided by the total volume of those candles.
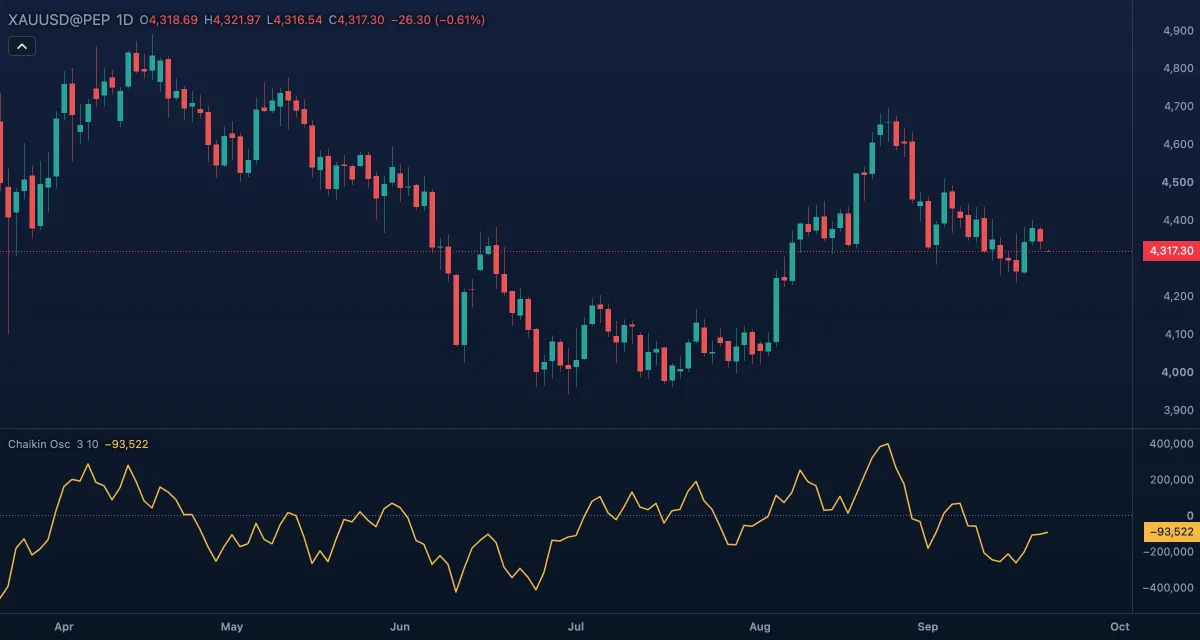 Chaikin OscillatorThe Chaikin Oscillator is the momentum of the Accumulation/Distribution Line: a fast exponential average of that line minus a slow one, 3 and 10 candles by default.
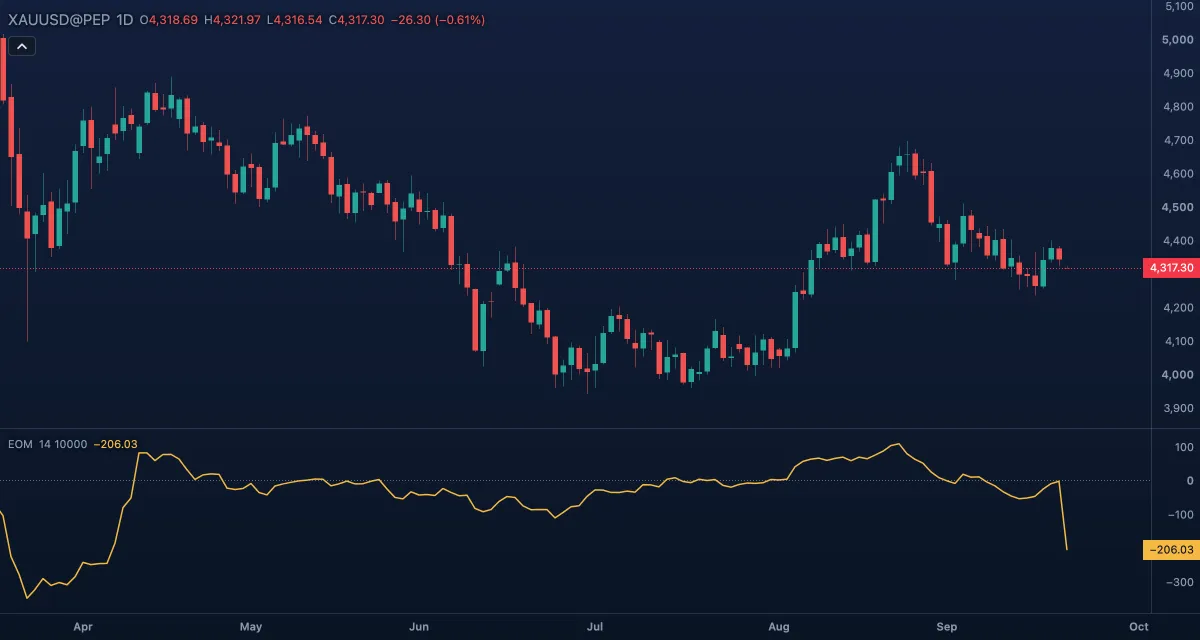 Ease of Movement (EOM)Ease of Movement measures how easily price moves: how far the candle's midpoint travelled for the volume it took.
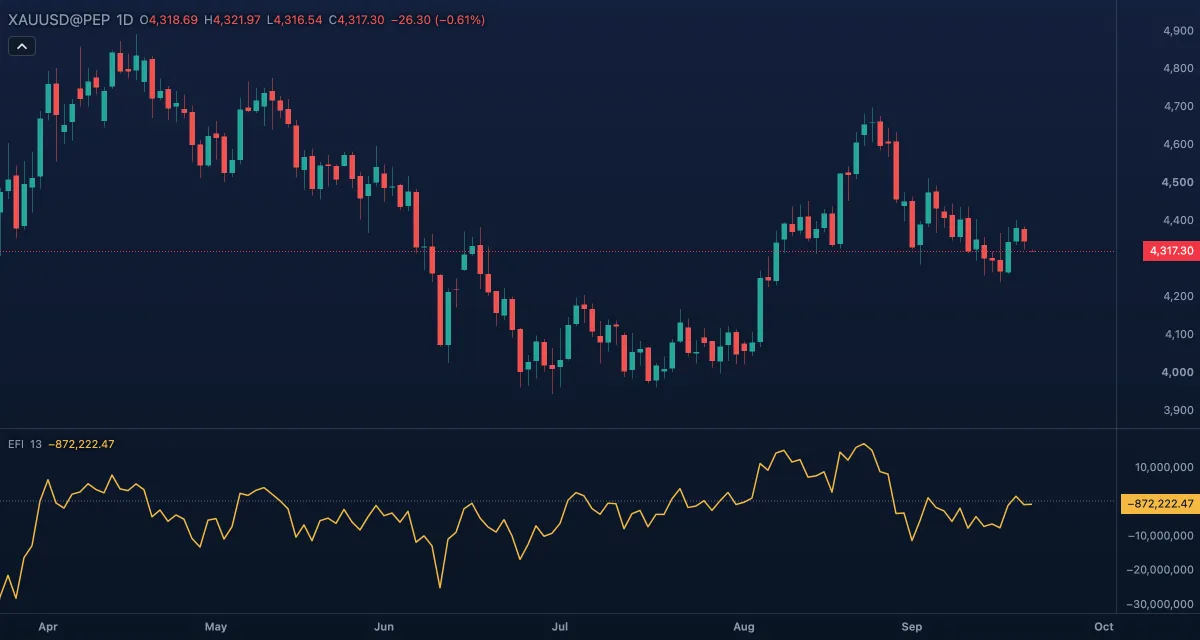 Elder Force Index (EFI)The Force Index measures the force behind a move: how much price changed in the candle, times the volume that moved it.
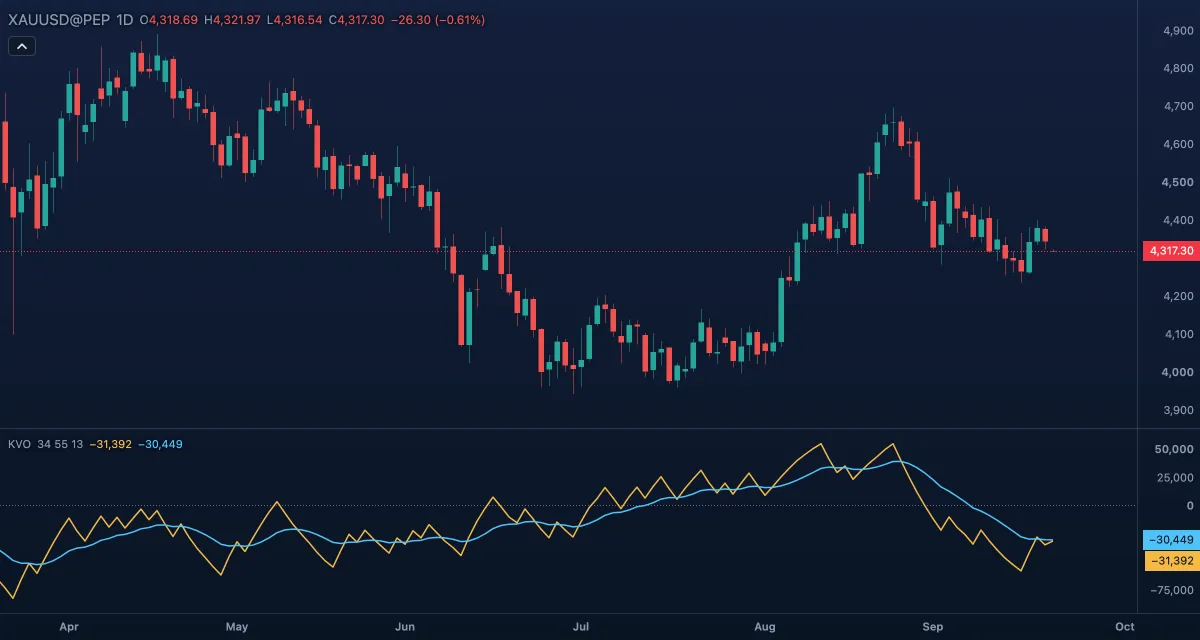 Klinger Volume Oscillator (KVO)The Klinger Volume Oscillator turns volume into a signed flow — positive when the candle's typical price rose, negative when it fell — and draws the difference of a fast and a slow exponential average of that flow, with a signal line.
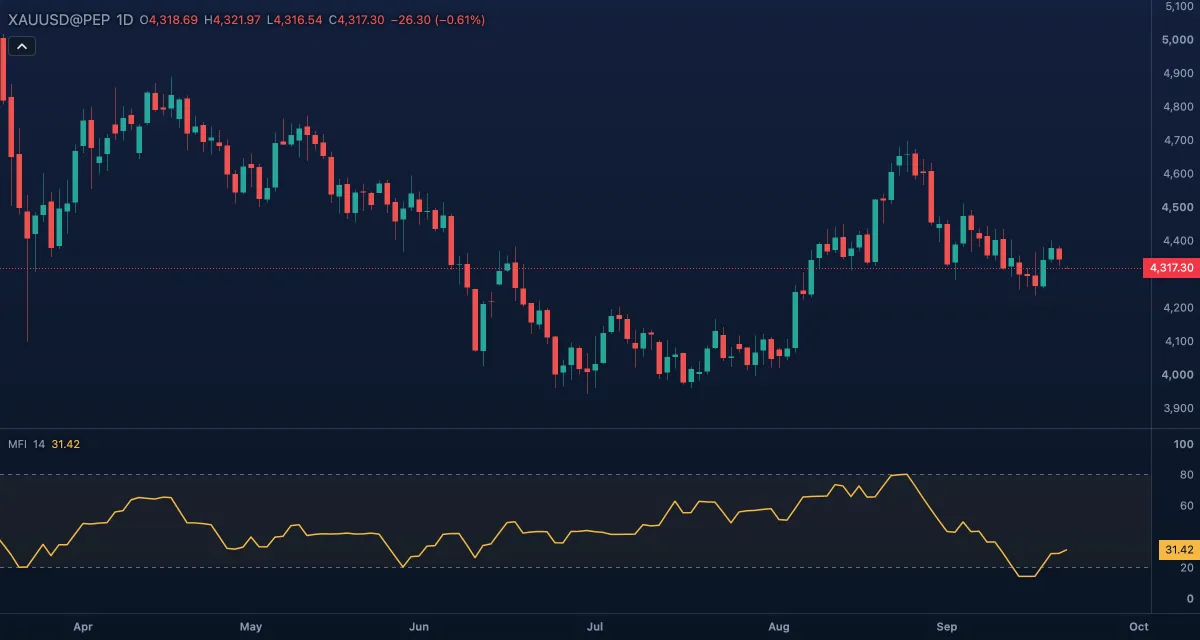 Money Flow Index (MFI)The Money Flow Index is a volume-weighted RSI.
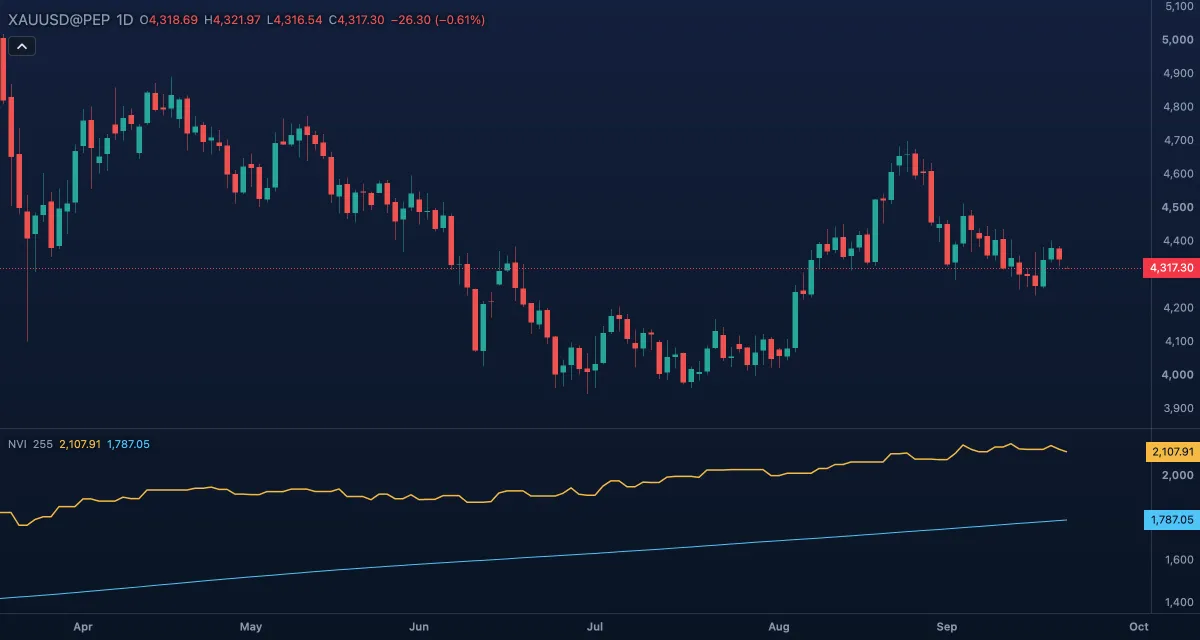 Negative Volume Index (NVI)The Negative Volume Index (NVI) is a running index that changes only on the bars whose volume fell below the previous bar's — the quiet bars, where the crowd is absent and the better-informed money is thought to act.
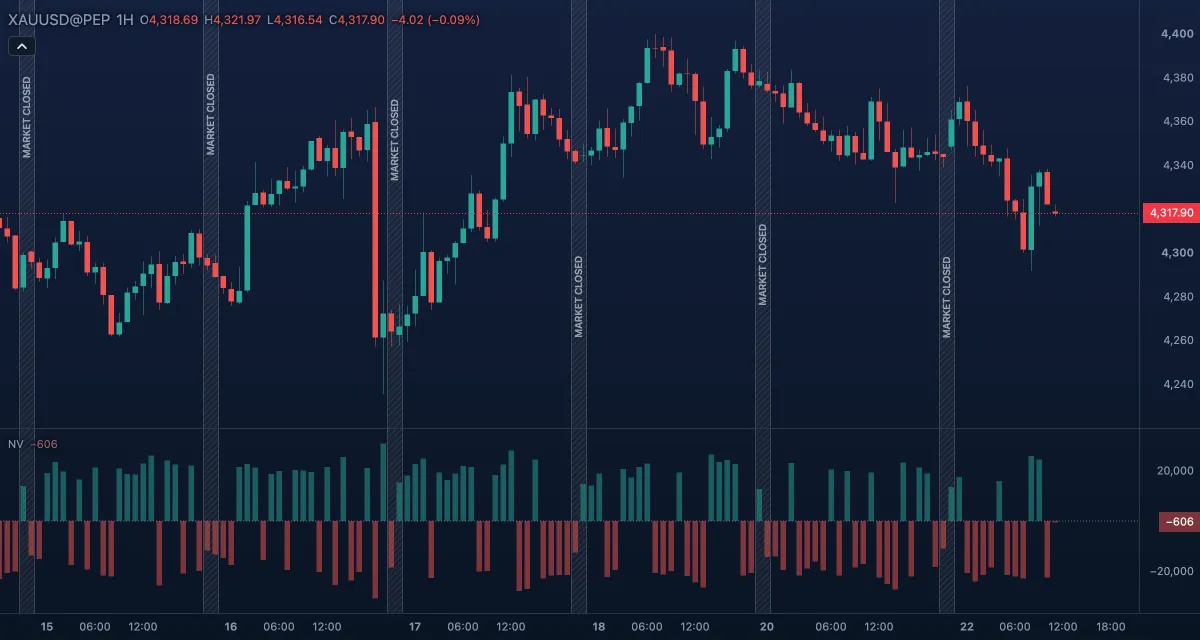 Net VolumeNet Volume is each bar's volume with a sign: positive when the bar closed above the previous close, negative when it closed below it.
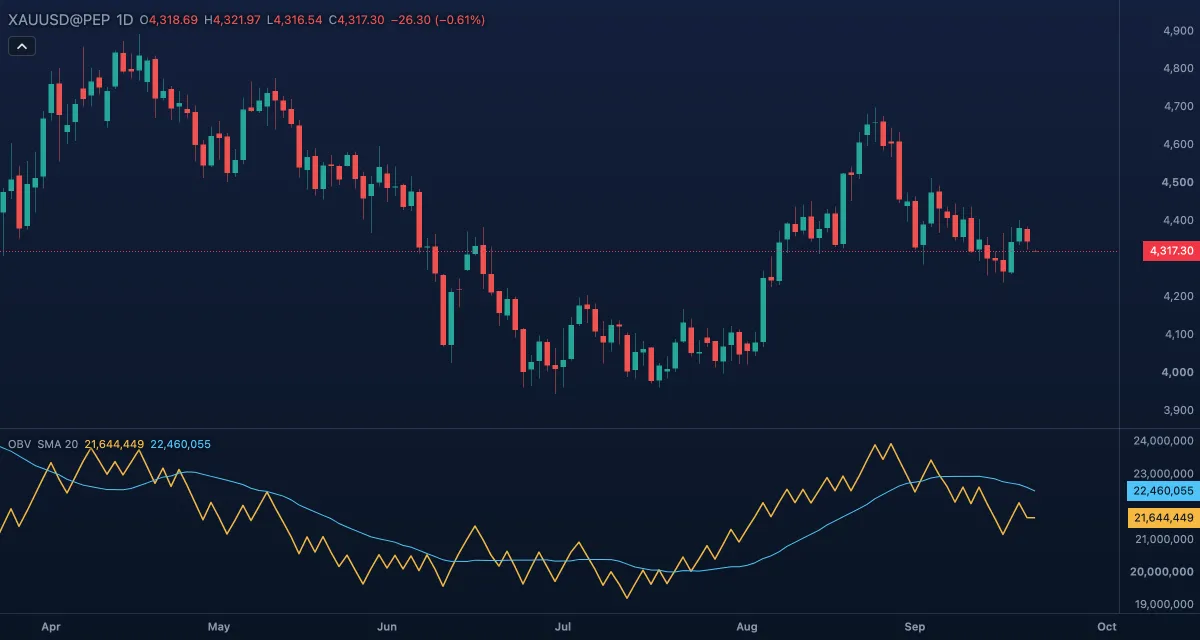 On-Balance Volume (OBV)On-Balance Volume (OBV) is a running total of volume: each bar's volume is added when the bar closes above the previous close and subtracted when it closes below it.
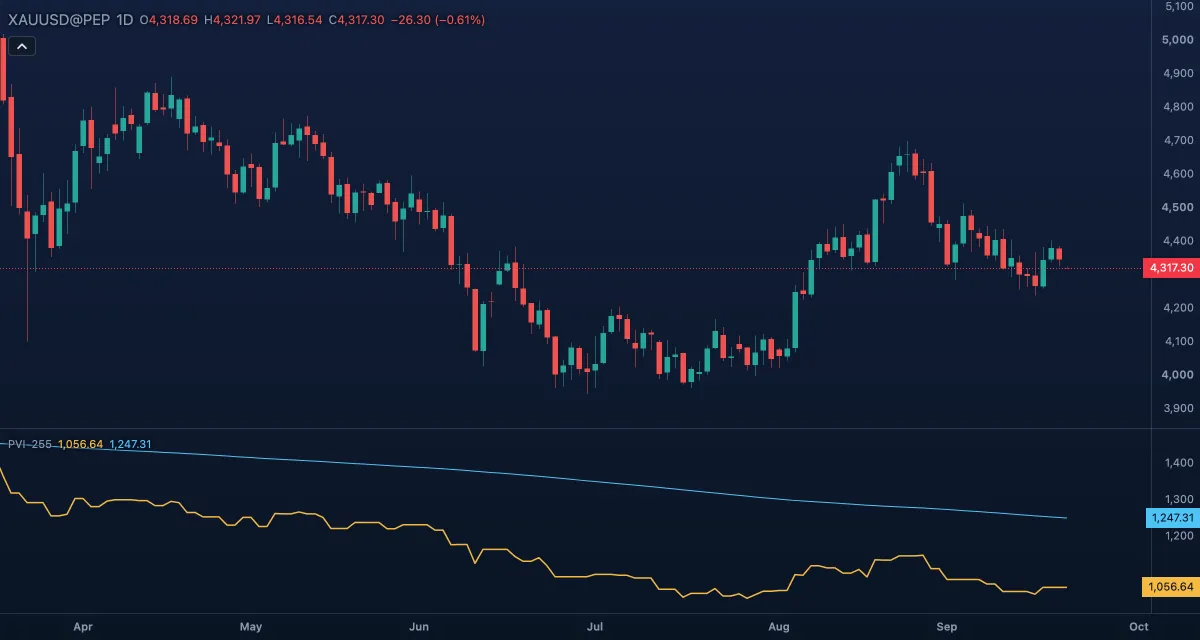 Positive Volume Index (PVI)The Positive Volume Index (PVI) is a running index that changes only on the bars whose volume rose above the previous bar's — the busy bars, where the crowd is active, so the index follows what the crowd does with price.
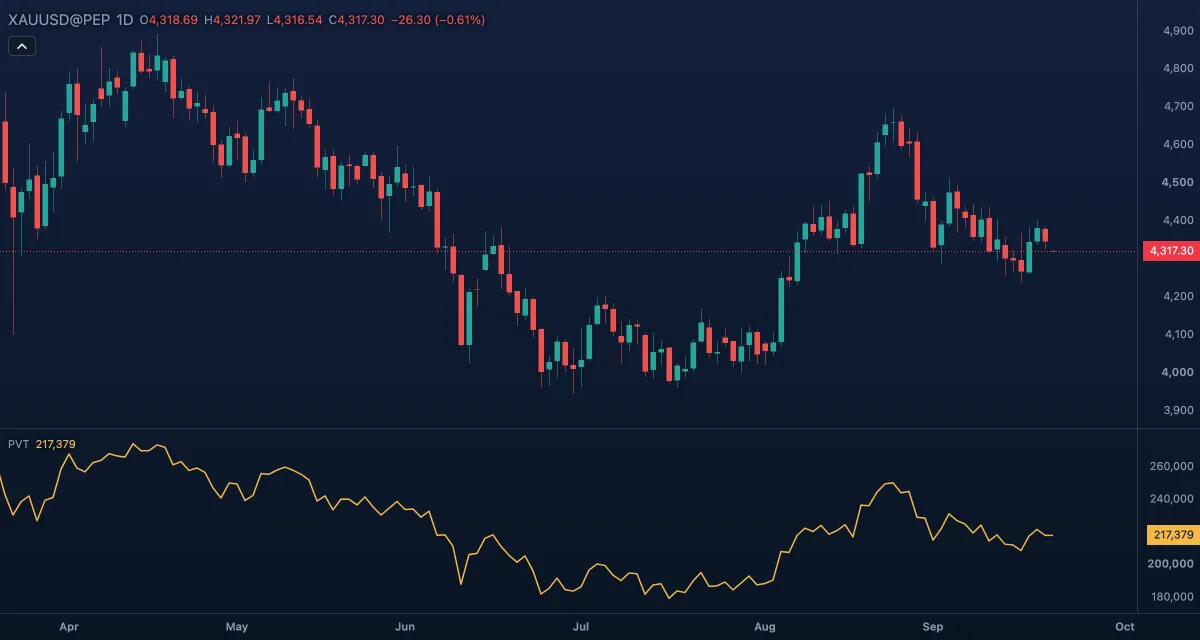 Price Volume Trend (PVT)Price Volume Trend (PVT) is a running total in which each bar adds its volume multiplied by the bar's percent price change.
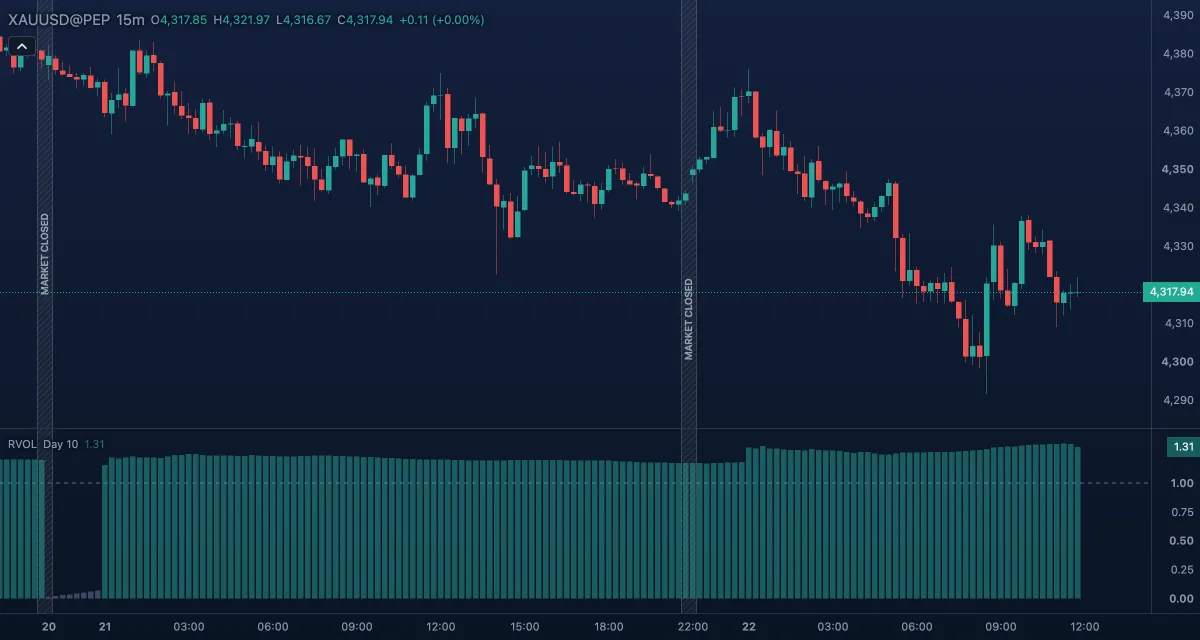 Relative Volume at Time (RVOL)Relative Volume at Time (RVOL) compares the volume of the current session so far with the volume the previous sessions had reached by the same time of day.
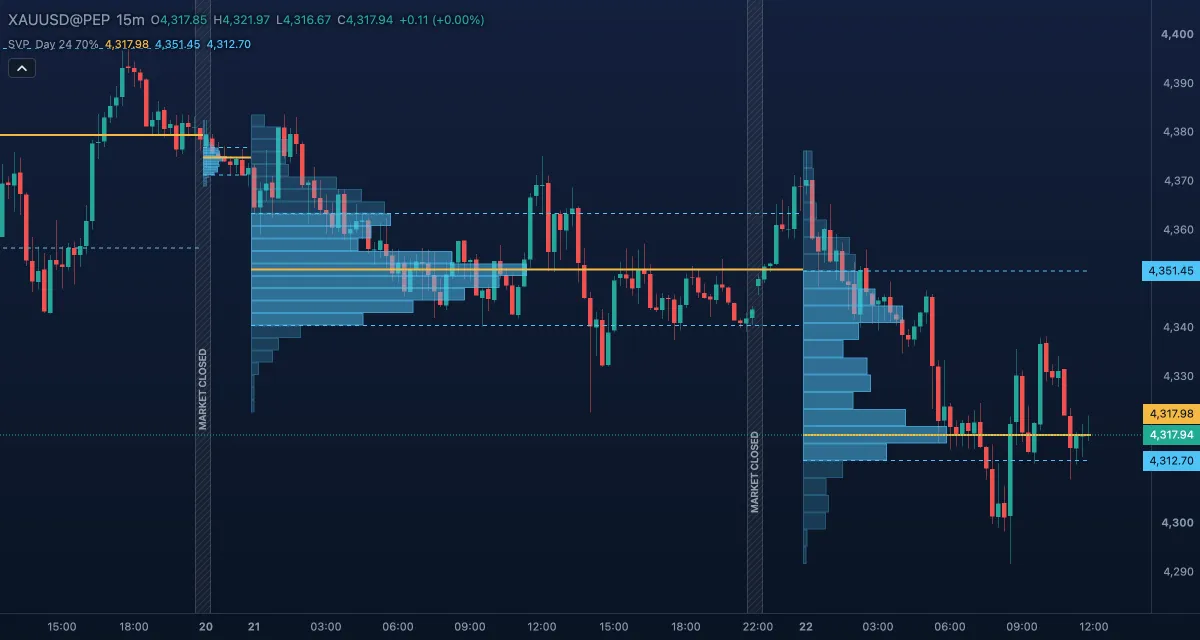 Session Volume Profile (SVP)The Session Volume Profile (SVP) draws, for each session, a sideways histogram of how much volume traded at each price — where, not when — with the session's point of control (the price with the most volume) and its value area (the prices that held most of the volume).
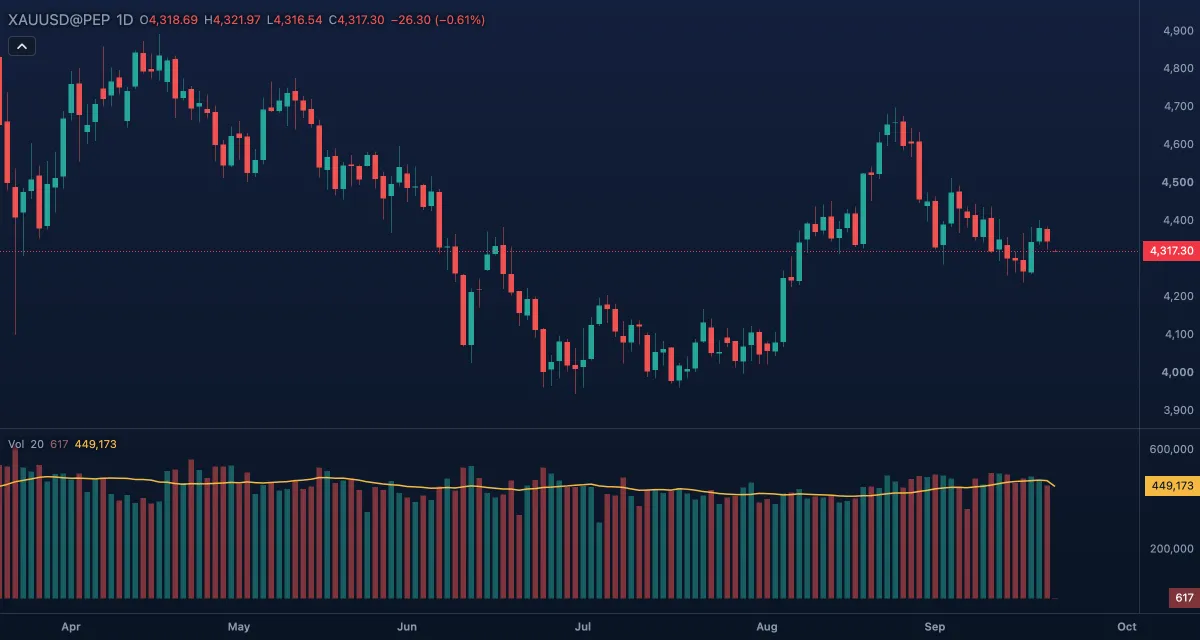 VolumeVolume is how much trading went into each candle, drawn as a column in its own pane under the chart.
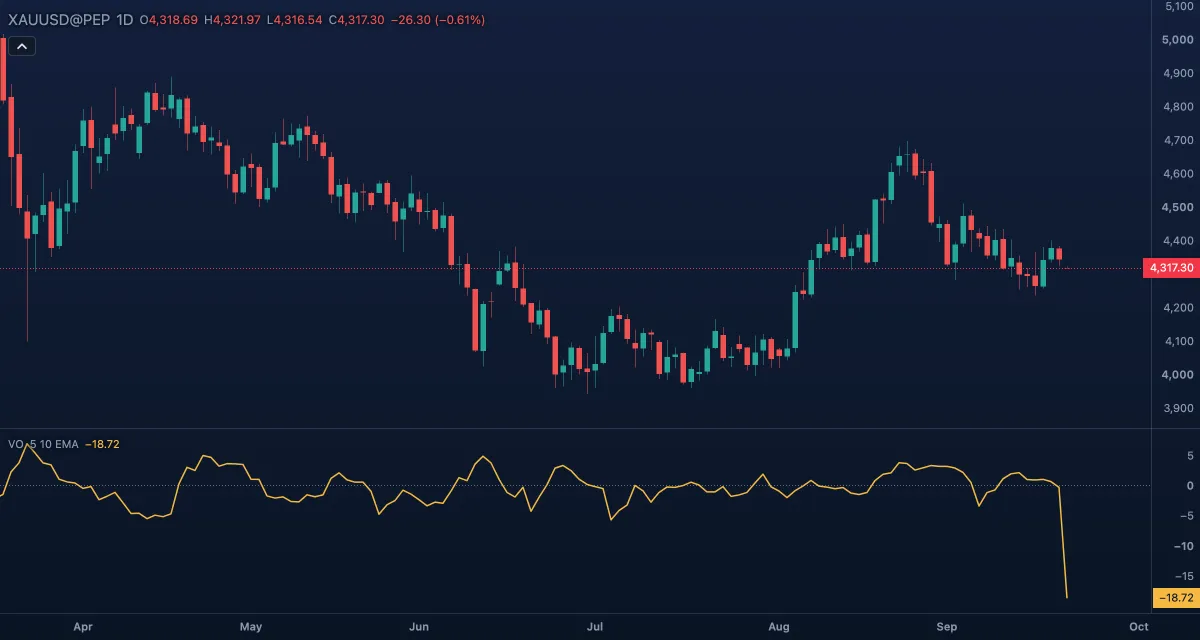 Volume Oscillator (VO)The Volume Oscillator (VO) measures whether volume is rising or falling: it is the percent gap between a fast and a slow moving average of volume.
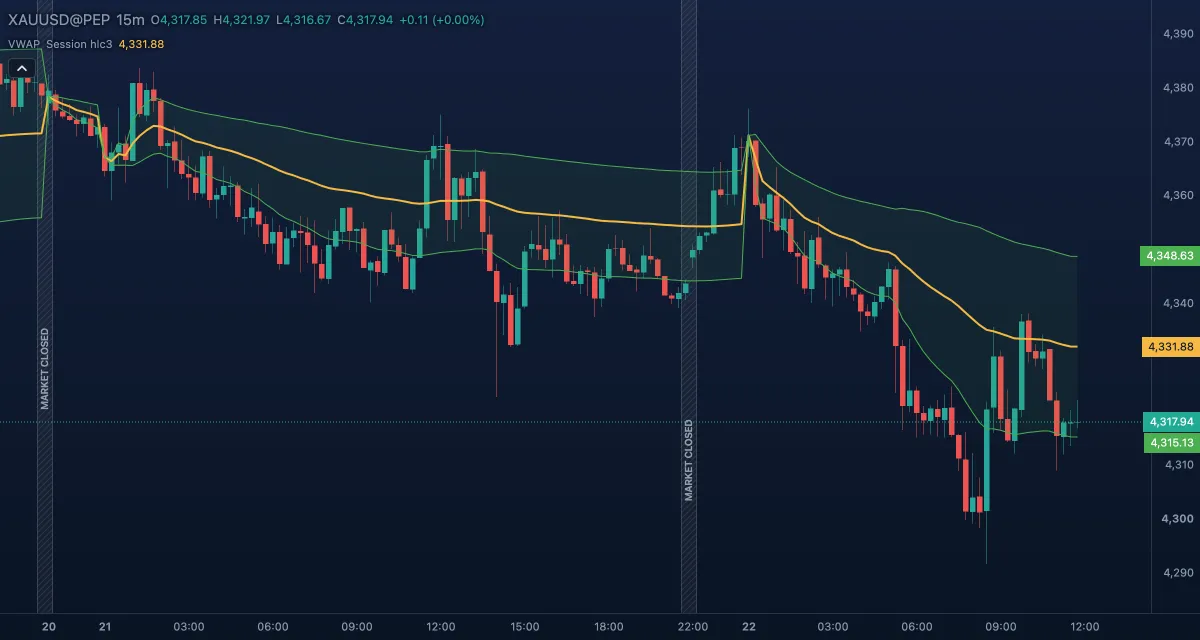 VWAPVWAP is the volume-weighted average price: the average price of the period so far, with every candle counting in proportion to its volume.
Price#
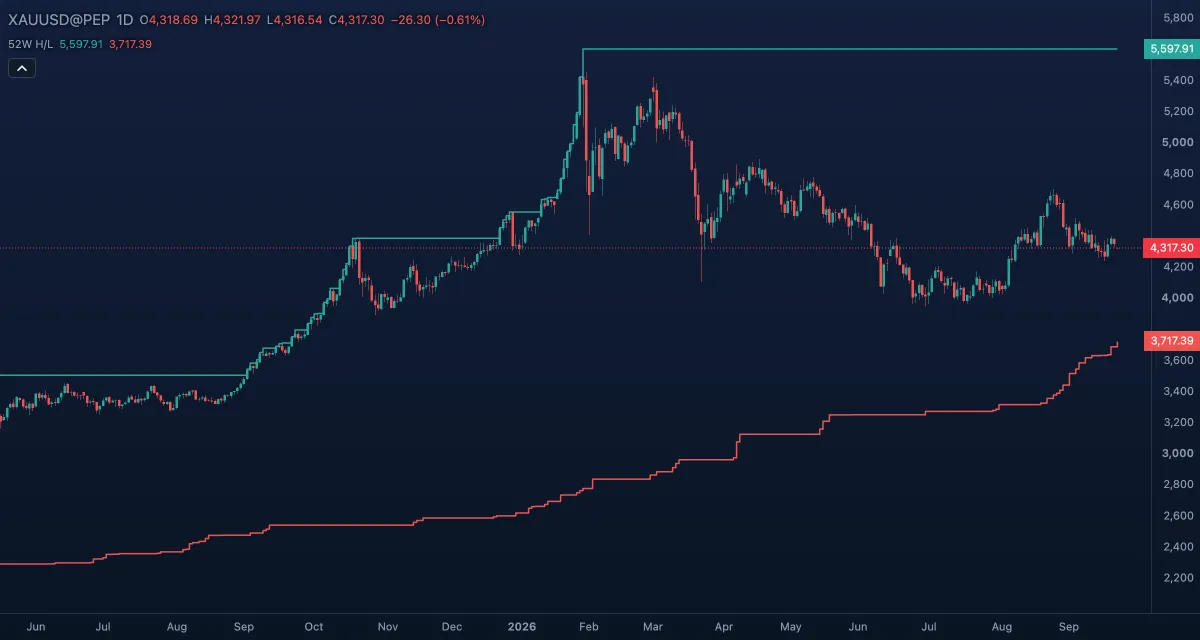 52-Week High and Low52-Week High and Low draws two step lines over the candles: the highest high and the lowest low of the last 52 weeks of trading.
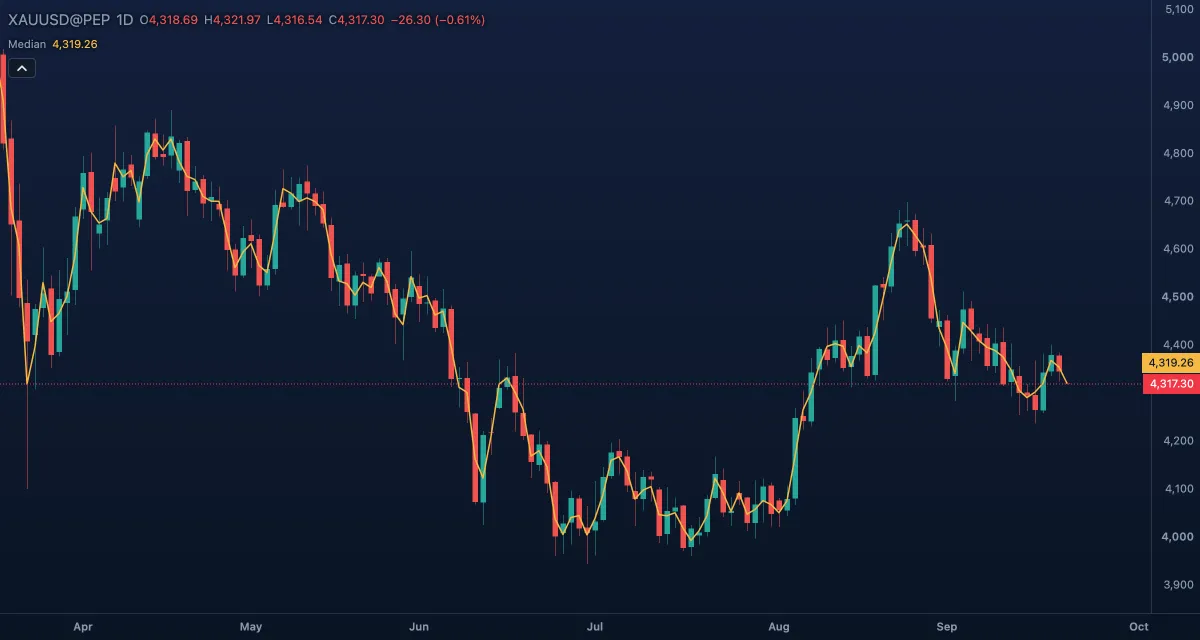 Median PriceMedian Price draws one line over the candles: the midpoint of each bar, halfway between its high and its low.
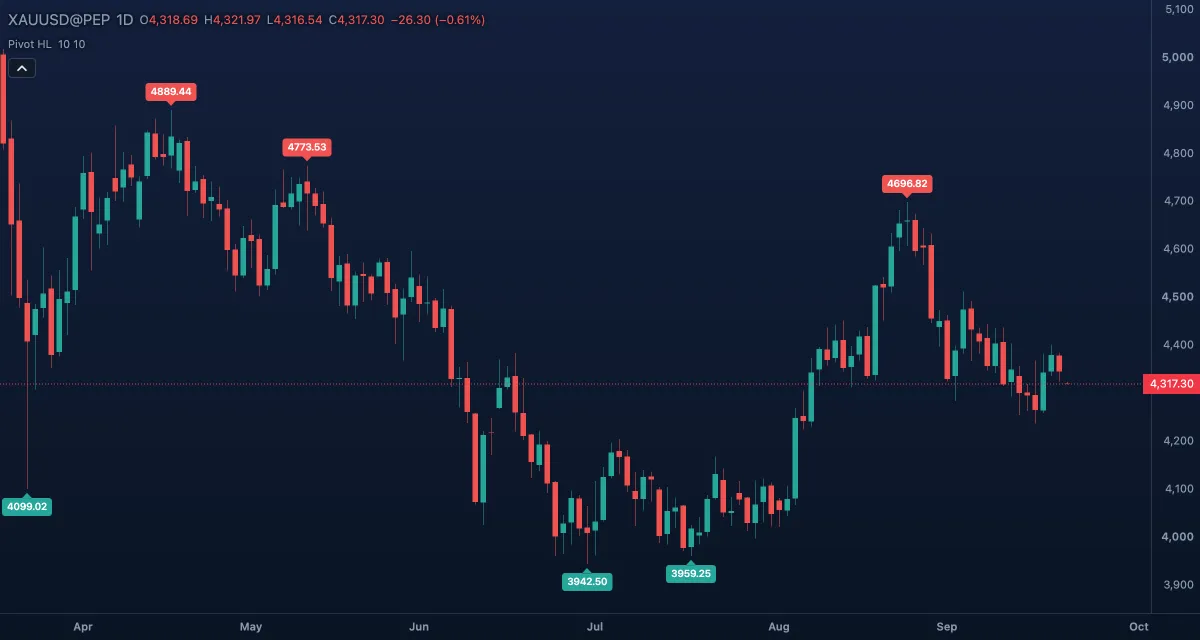 Pivot Highs and LowsPivot Highs and Lows marks the swing points of the chart: a bar whose high stands above the bars around it gets a label with its price above it; a bar whose low stands below its neighbours gets one below.
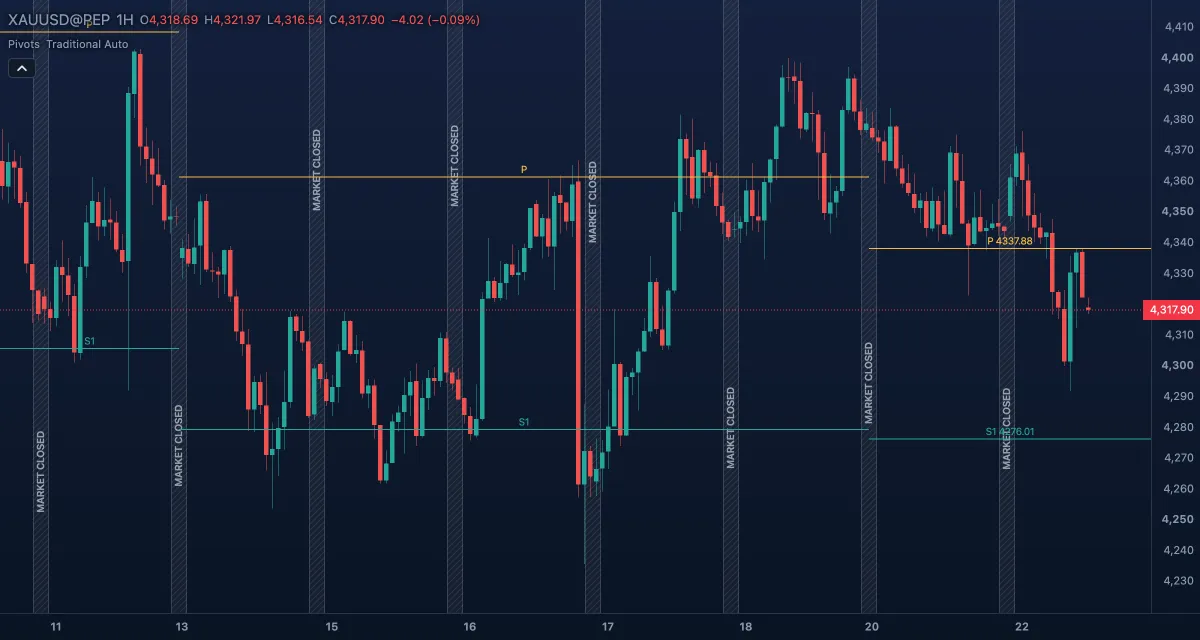 Pivot PointsPivot Points draws a set of horizontal levels for each period — a central pivot (P) with resistance levels above it (R1, R2 …) and support levels below (S1, S2 …) — calculated from the previous period's high, low and close.
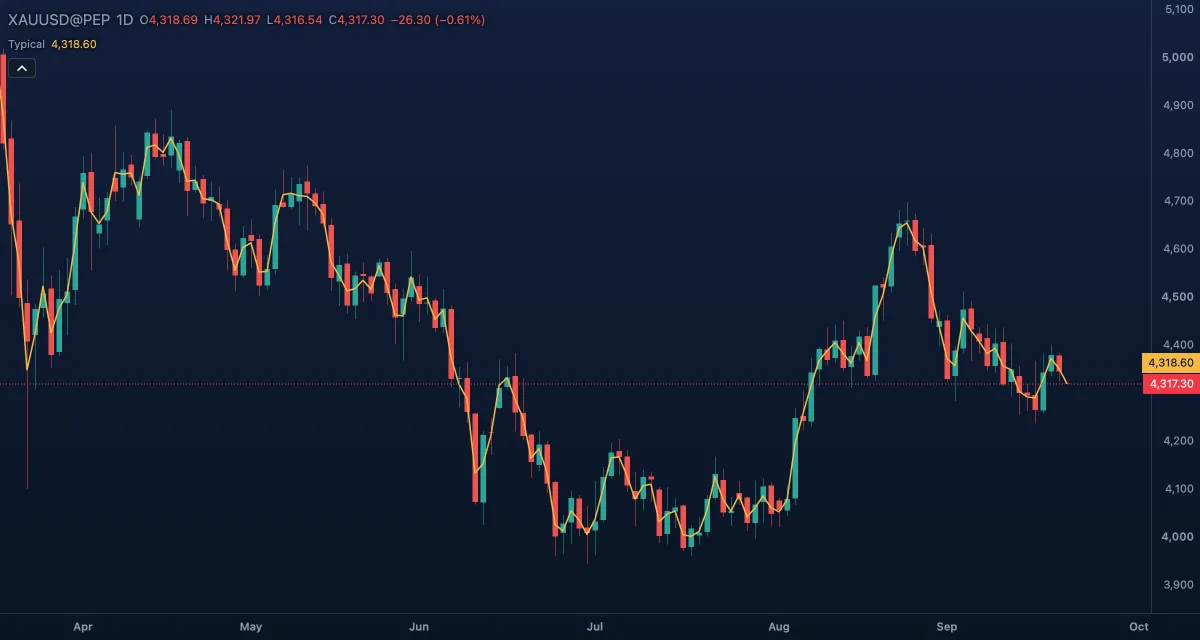 Typical PriceTypical Price draws one line over the candles: the average of each bar's high, low and close.
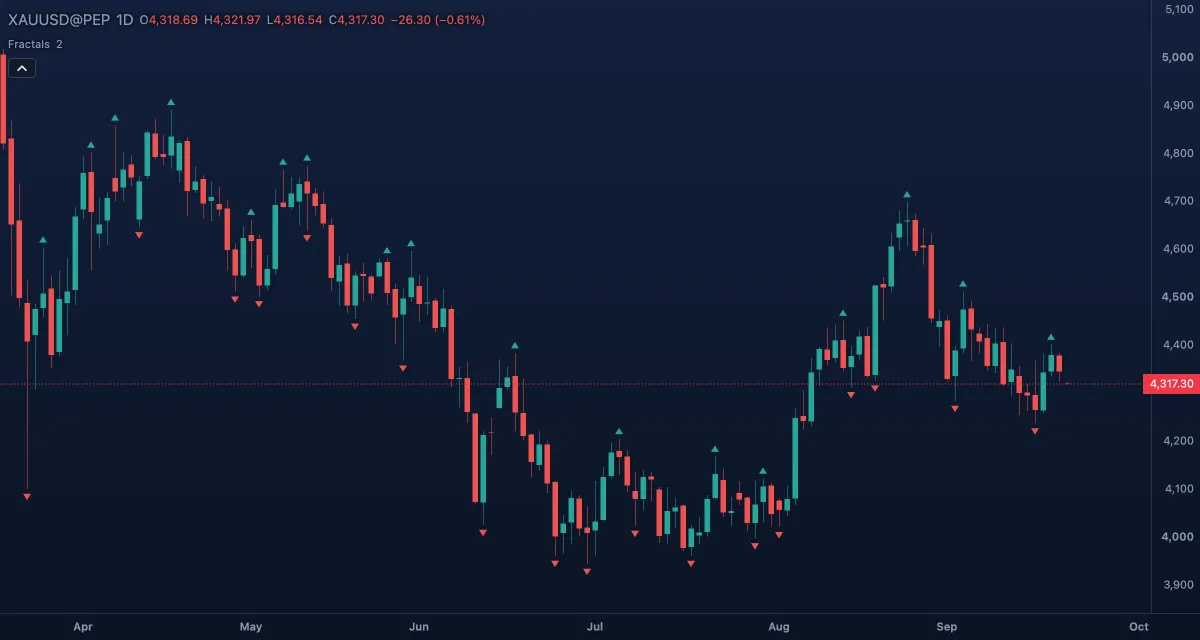 Williams FractalsWilliams Fractals marks the local tops and bottoms of the chart with small triangles: an up fractal above a bar whose high is the highest of the five bars around it, a down fractal below a bar whose low is the lowest.
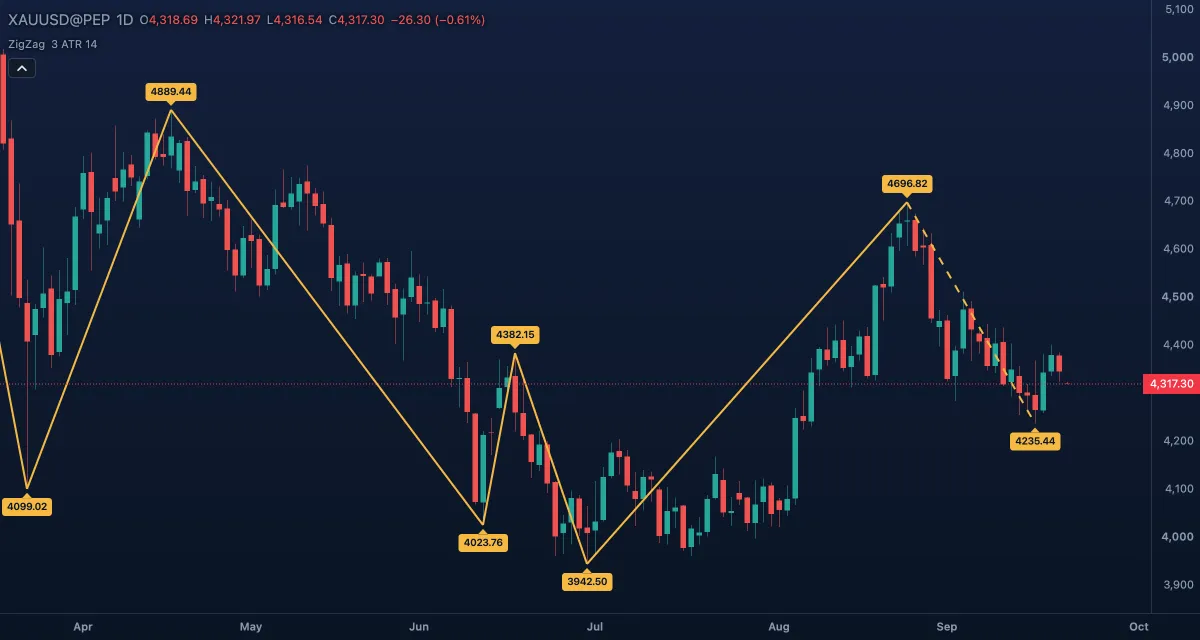 Zig ZagZig Zag joins the significant swing highs and lows of the chart with straight lines and ignores every move smaller than a threshold.