Vortex Indicator
What the Vortex Indicator's VI+ and VI− lines measure, how their crosses mark a change of trend, its settings on MillionChart and an example on gold.
The Vortex Indicator compares how far the bars have pushed up with how far they have pushed down over the last 14 bars, and draws the two results as lines, VI+ and VI−, that cross when the trend turns. Both are ratios that move around 1. Etienne Botes and Douglas Siepman published it in 2010.
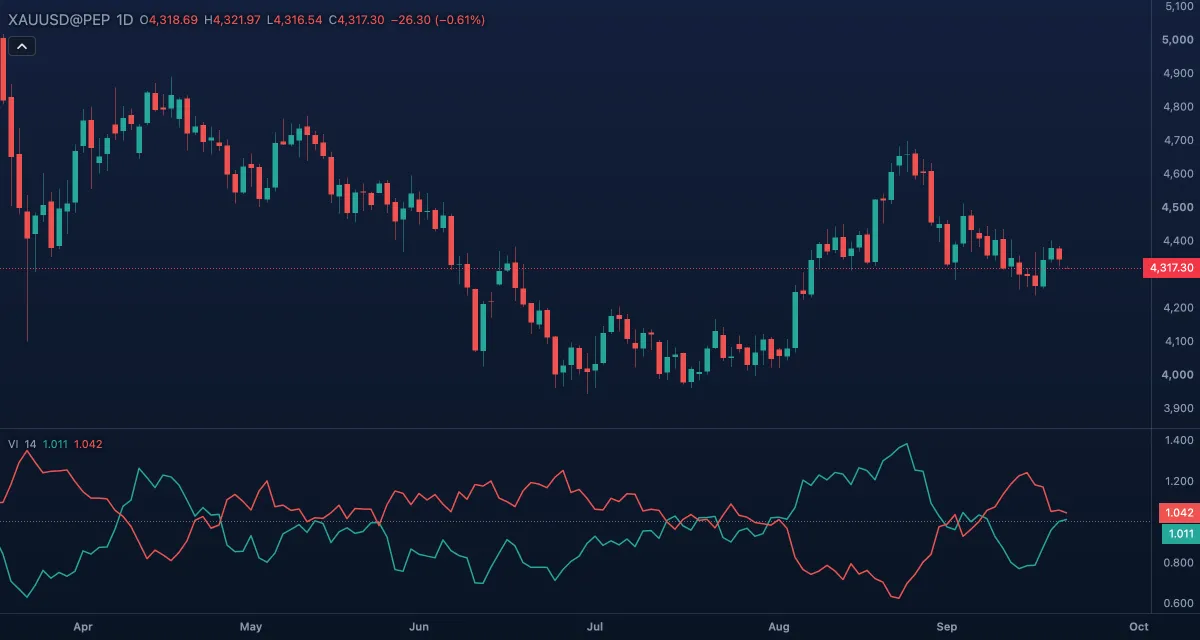
What it shows#
- VI+ — the green line in its own pane; it rises when the bars reach higher above the previous bar's low.
- VI− — the red line; it rises when the bars reach further below the previous bar's high.
- Level 1 — a dotted line at 1.0, the middle of the pane.
- VI+ above VI− reads as an up trend, VI− above VI+ as a down trend; the wider the gap, the stronger the trend. Values are shown with three decimals, since the lines usually differ by hundredths.
How it is calculated#
For every bar, the upward movement is the distance from the bar's high to the previous bar's low, and the downward movement the distance from the bar's low to the previous bar's high. VI+ is the sum of the upward movements over Length bars divided by the sum of the true range over the same bars; VI− is the same with the downward movements. (The true range is the bar's range widened to include any gap from the previous close.) Length 14 is the authors' default.
How traders use it#
- VI+ crossing above VI− is the up signal, VI− crossing above VI+ the down signal; most traders wait for the bar to close.
- A cross where the rising line is already above 1 carries more weight than one with both lines under it.
- Two lines tangled around 1 mean no trend; the indicator is a filter as much as a signal.
- A widening gap confirms the move; a narrowing one warns that it is losing push.
- Watch out: in a sideways market the lines cross often, and each cross comes a few bars after the turn, because both lines are sums over 14 bars. Pair it with ADX or a moving average.
Settings#
| Setting | Default | What it changes |
|---|---|---|
| Length | 14 | The number of bars summed. Shorter reacts faster and crosses more often; longer is calmer and later. |
| Colours and style | — | VI+, VI− and Level 1 set the colours of the two lines and of the 1.0 level. |
Example on gold#
For example, gold has drifted around $4,250 for two weeks and the two lines sit tangled near 1. Then three wide up days take gold to $4,330; VI+ climbs to about 1.2 while VI− drops toward 0.8, crossing on the second of those days. A trader reads that as the start of an up trend and looks for a long on the next pullback, with a stop under its low.
What invalidates it: VI+ falling back under VI− within a few bars, or the gap never opening beyond a few hundredths — the push ran out and the chart is still in a range.
Add it to your chart#
- Click Indicators in the top strip (on the Pro screen, press I).
- Type
vortexand click Vortex Indicator. - Click its chip in the legend (VI 14) to open the Inspector and change the settings; drag the chip to reorder; the dot hides it; × removes it.
Related#
- Directional Movement Index (DMI) — Wilder's +DI and −DI, the same idea with a different measure
- Average Directional Index (ADX) — trend strength without direction, a filter for Vortex crosses
- Aroon — another pair of lines whose cross marks a new trend
- Alerts — an alert when VI+ crosses VI−
- Adding and tuning indicators