Fibonacci
The Fib retracement and Fib extension: what the levels mean, how to lay them over a swing and how to edit them.
The Fibonacci group has two tools that divide a swing into ratios: the retracement, which shows how far a pullback has given back, and the extension, which projects the next leg. Hover the Fibonacci tile on the rail (the left tool bar) to open the list; the tile arms the tool you used last. On a phone tap Draw, then Fibonacci. The star next to a tool puts it on the favourites bar over the chart (the first five starred tools also sit at the top of the rail; ten at most). Both tools take their points better with the magnet on (the rail's Magnet, weak or strong), which snaps a click to the candle's high or low. Every drawing also has a Note field in the Inspector; the note shows when you point at the drawing.
Fib retracement#
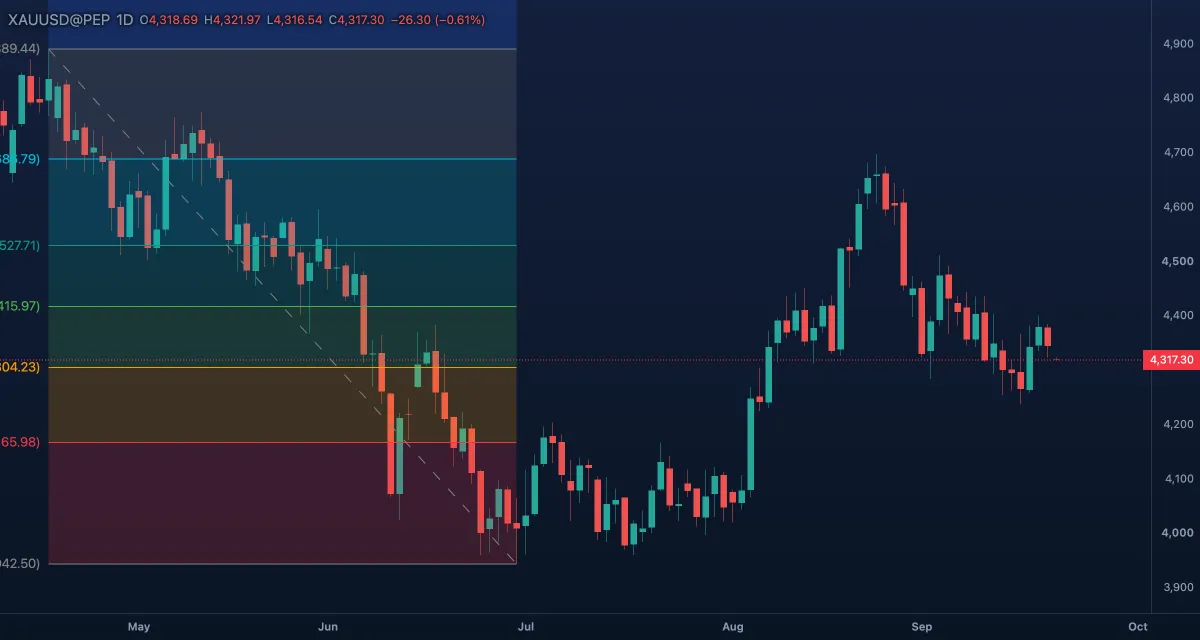
What it draws. Horizontal levels across the swing between your two clicks: 0 at the second click, 1 at the first, and 0.236, 0.382, 0.5, 0.618 and 0.786 between them, each in its own colour, with tinted bands between and the ratio and price on the left, as in 0.5 (4,330.54). The levels 1.618 to 4.236 run on past the swing's start; a grey dashed swing line joins the points. The Helpers tile › Auto fib lays one over the swing on screen for you, as an ordinary drawing you can move, keep or delete.
What it is for. Where a pullback often stops: 38.2 %, 50 %, 61.8 %. A pullback that turns at 0.382 says the trend is strong; one that reaches 0.786 says it is tired. The usual mistake is measuring the wrong swing: take the move that is in play, from its start to its end.
How to draw it. Click where the swing starts, then where it ends: for a rally, the low then the high. No Shift; Esc cancels. A double-click opens the Inspector; drag a handle to move a point, drag the body to move all. On the Pro screen F arms it.
Settings.
| Setting | Default | What it does |
|---|---|---|
| Levels | the eleven above | A row per level: shown, value, colour, remove; Add level |
| Width, Line style | 1, solid | The level lines |
| Extend right | off | The levels run on to the right edge |
| Reverse the levels | off | 0 at the first click, 1 at the second |
| Fill | on, 20 % | The bands between the levels |
| Level text | Left | Left, Right or None |
| Price on the scale | on | The price beside each ratio |
| Text size | 13 | |
| Swing line | on, grey | The dashed line between the points |
Example. Gold rallied for two weeks and is pulling back. Click the low where the rally began, then its high. The pullback's candles sit between 0.382 and 0.5: a normal correction. Right-click the chart at the 0.618 level › Add alert at … to be told if it goes deeper.
Fib extension#
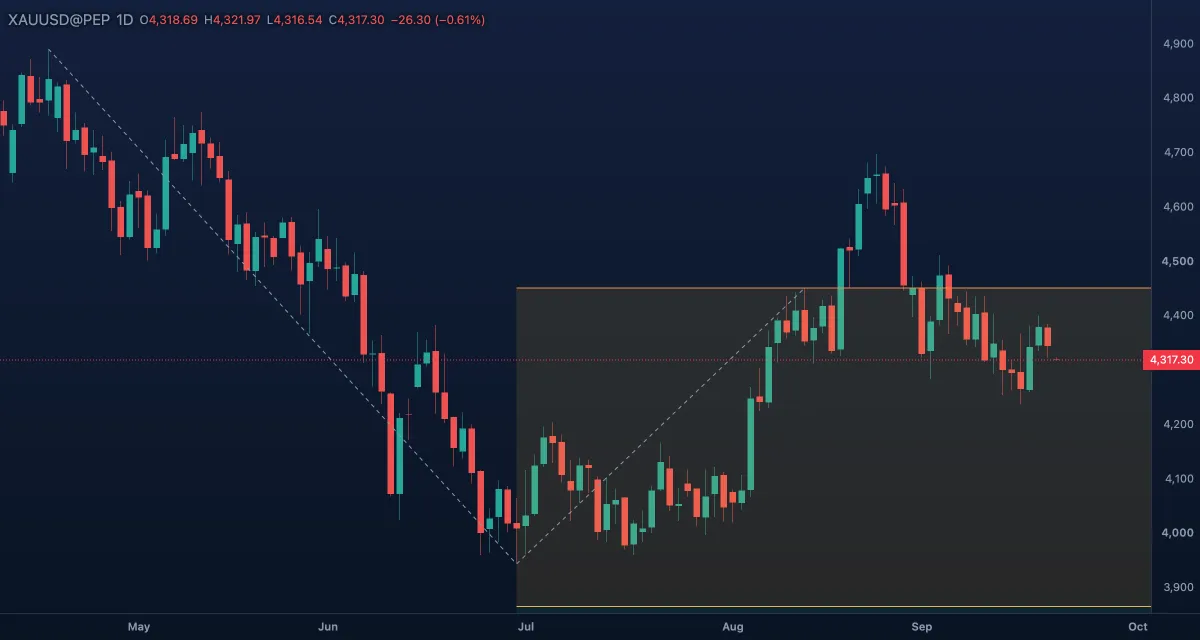
What it draws. Levels projected from a pullback by the size of the leg before it. You click the swing's start A, its end B, then the pullback's end C: level 0 sits at C, level 1 at C plus the first leg (B minus A), with 0.618, 1.272, 1.618, 2 and 2.618 between and beyond. The levels run from the swing's end one leg's length past the pullback, each with its ratio and price on the right; a grey dashed path joins A, B and C.
What it is for. Where the next move may reach: 100 %, 161.8 %. After a pullback the next leg often equals the first (level 1, the measured move) or stretches to 1.618; these are the usual places to take profit. The usual mistake is clicking C before the pullback has ended; wait for the turn, then draw.
How to draw it. Click the swing's start, its end, then the pullback. No Shift; Esc cancels. A double-click opens the Inspector; drag a handle to move a point, drag the body to move all. On the Pro screen Shift+F arms it.
Settings. The retracement's rows without Reverse the levels: Levels (0, 0.618, 1, 1.272, 1.618, 2, 2.618), Width 1, Line style solid, Extend right off, Fill on at 12 %, Level text Right, Price on the scale on, Text size 11, Swing line on in grey.
Example. Gold ran from a low to a high, pulled back and turned up again. Click the low, the high, then the pullback's low. Level 1 is where a leg as long as the first would end, 1.618 the stretched target; a long position with its target there shows the reward against your stop.
Related#
- Drawing on the chart — selecting, handles, the magnet, lock, hide and undo
- Lines — the trend lines the swings run along
- Trade & measure — a position with its target on a level
- Patterns — ABCD and XABCD, built on the same ratios
- Alerts — a fib level does not ring by itself; a price alert at the level does