Bollinger BandWidth (BBW)
What Bollinger BandWidth measures, Bollinger's Squeeze line, how to read a narrowing or widening of the bands, its settings and an example on gold.
Bollinger BandWidth measures how wide the Bollinger Bands are, as a percentage of their middle line. A low value means the bands are narrow and the market is quiet; a high value means they are wide and the market is moving. John Bollinger described it in Bollinger on Bollinger Bands (2001), and on MillionChart it comes with his Squeeze reference line.
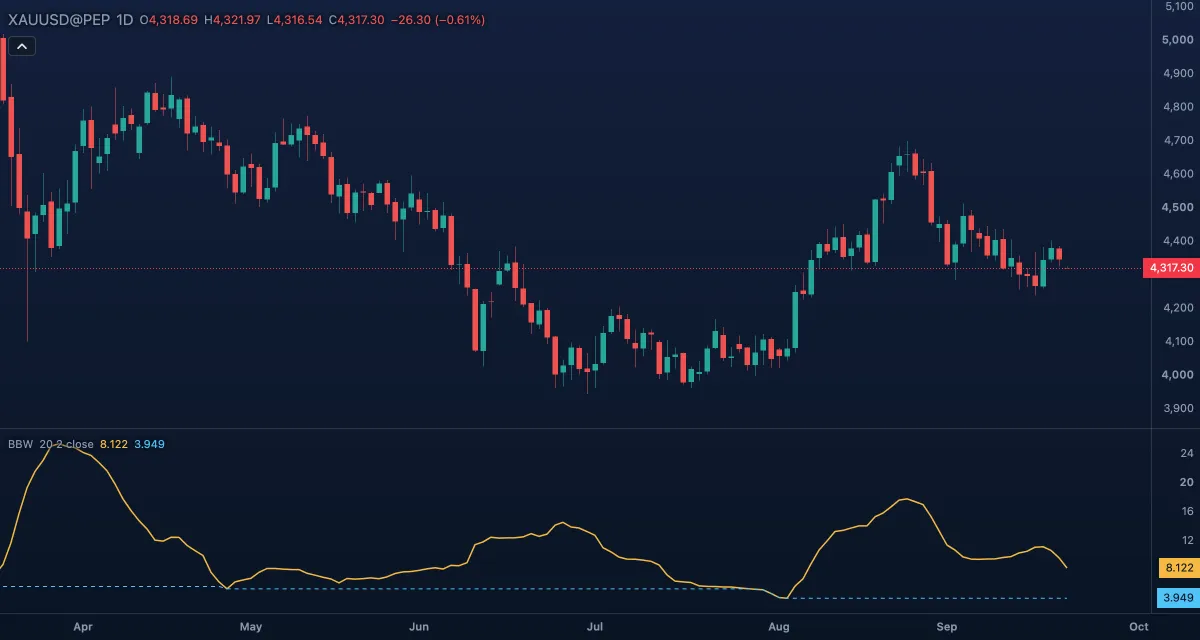
What it shows#
- BandWidth — a line in its own pane: the distance from the lower to the upper Bollinger Band, divided by the middle line, times 100. Rising means the bands are opening (volatility expanding); falling means they are closing.
- Squeeze — a dashed line: the lowest BandWidth of the last 125 bars. When the BandWidth line comes down to touch it, the bands are at their narrowest in about six months of daily candles — Bollinger's Squeeze.
- There are no fixed levels: a "low" BandWidth depends on the symbol and the timeframe, which is why the Squeeze line is drawn from the indicator's own history.
How it is calculated#
The indicator first builds the Bollinger Bands from Source and Length: a simple moving average (the basis) with a band StdDev multiplier standard deviations above it and one below. BandWidth = (upper band − lower band) / basis × 100 — with the defaults, four standard deviations of the last 20 closes as a percentage of their average. The Squeeze line is the lowest BandWidth over Squeeze lookback bars. The standard deviation is the same one the Bollinger Bands use, so the two always agree.
How traders use it#
- A Squeeze (BandWidth down at the Squeeze line) says the market has been unusually quiet, and quiet stretches tend to end with a strong move. The indicator does not say in which direction.
- The direction comes from the breakout: a close outside a band while BandWidth turns up. Mark both edges of the quiet range and wait for the close that leaves it.
- A very high BandWidth after a long run often marks exhaustion: the bands are stretched and a pause or a turn is common.
- Compare values only on the same symbol and timeframe: 5 on daily gold and 0.4 on 5-minute gold can both be normal.
- Watch out for: BandWidth confirms a breakout a few bars late, and the first break out of a Squeeze is sometimes a head fake that reverses. A close beyond the band is a better trigger than a wick.
Settings#
| Setting | Default | What it changes |
|---|---|---|
| Length | 20 | Bars in the moving average and the standard deviation. Longer is smoother and slower. |
| StdDev multiplier | 2 | How many standard deviations the bands sit from the basis. It scales every value equally: the numbers change, the shape does not. |
| Source | Close | The price the bands are built on: Close, Open, High, Low, Mid, Typical or Average. |
| Squeeze line | On | Draws the Squeeze reference line. |
| Squeeze lookback | 125 | Bars over which the lowest BandWidth is found; 125 daily bars is about six months. |
| Colours and style | — | The colours of the BandWidth line and the Squeeze line. |
Example on gold#
For example, gold has spent a month between $4,250 and $4,320 and the daily candles have become small. The 20-day bands have closed in, and the BandWidth line, at about 3, touches the Squeeze line: the narrowest in six months. You do not know which way the market will leave the range, so you mark both edges and wait.
A daily close at $4,360, above the upper band, with BandWidth turning up, would support a long with the stop under the range at $4,240. If the close falls back inside the range within a day or two and BandWidth flattens again, the breakout failed.
Add it to your chart#
- Click Indicators in the top strip (on the Pro screen, press I).
- Type
bbwand click Bollinger BandWidth. - Click its chip in the legend to open the Inspector and change the settings; drag the chip to reorder; the dot hides it; × removes it.
Related#
- Bollinger Bands — the bands this indicator measures; put both on the chart to see the Squeeze on the candles
- Bollinger %B — where the price sits within the bands, the companion to BandWidth
- Squeeze Momentum — the same idea with a Keltner Channel and a momentum histogram for direction
- Alerts — an alert when the value crosses a level
- Adding and tuning indicators