Accumulation/Distribution Line (A/D)
What the A/D line measures, how the close's place in the range weights volume, how to read it against price on MillionChart, with an example on gold.
The Accumulation/Distribution Line adds up each candle's volume weighted by where the candle closed inside its range: a close near the high counts as accumulation (buying), a close near the low as distribution (selling). It is a running total with no fixed range, so only its direction, and its shape against price, matter. Marc Chaikin devised it.
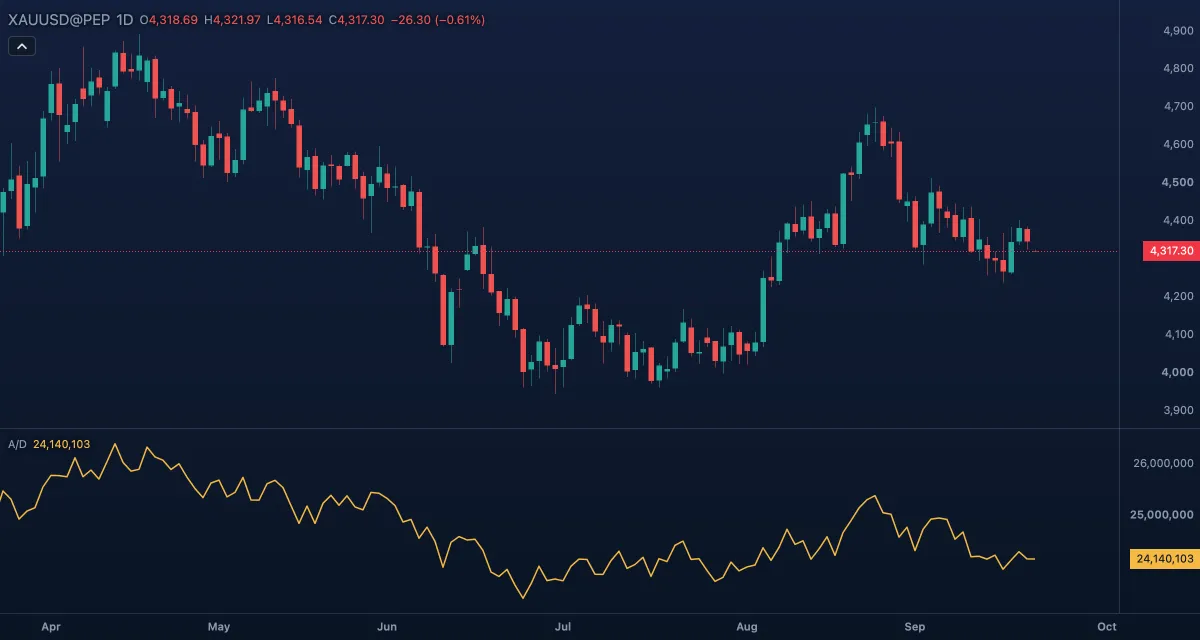
What it shows#
- A/D — a gold line in its own pane. It rises when candles close in the upper part of their range on good volume and falls when they close in the lower part. The level means nothing — it depends on where the loaded history starts — but the slope and the highs and lows do.
- No levels and no zero line. The line starts at the first complete candle of the loaded history.
- The scale is in volume units, without decimals.
How it is calculated#
For each candle, the close location value = ((close − low) − (high − close)) / (high − low): −1 for a close at the low, +1 at the high, 0 when the high equals the low. The line adds close location value × volume to its previous value. There are no inputs — Chaikin gave the line none — and only its colour can be changed.
How traders use it#
- Confirmation: price and A/D rising together is a healthy uptrend — strong closes with volume behind them.
- Bearish divergence: price makes a higher high while A/D makes a lower high — the new high was made on weak closes or thin volume. The mirror at lows is a bullish divergence.
- Early turn: A/D breaking its own trend line, or a recent low, before price does is a common warning.
- Range reading: in a sideways range a rising A/D hints at accumulation and makes a break upward more likely; a falling one hints at distribution.
- Watch out for: a gap is invisible to the line, because only the candle's own range counts, so a symbol that gaps can rise while A/D falls; one huge-volume candle shifts the line for good; on gold and forex it is tick volume.
Settings#
| Setting | Default | What it changes |
|---|---|---|
| Colours and style | — | A/D line (the colour); width and visibility under Lines in the Inspector. There are no calculation inputs. |
Example on gold#
Suppose gold on daily candles pushes from $4,280 to a new high at $4,360 over three weeks, but most of the up candles close in the lower half of their range and the A/D line tops out below its previous peak. For example, a trader holding a long reads this as distribution behind the new high, and tightens the stop to just under the last swing low at $4,320 rather than adding.
What invalidates it: a few wide candles closing near their highs that carry A/D to a new peak of its own — price and the line agree again, and the caution is withdrawn.
Add it to your chart#
- Click Indicators in the top strip (on the Pro screen, press I).
- Type
adland click Accumulation/Distribution Line, or press Enter for the first result. - Click its chip in the legend to open the Inspector and change the settings; drag the chip to reorder; the dot hides it; × removes it.
Related#
- Chaikin Money Flow — the same weighting over a window, as a ratio from −1 to +1
- Chaikin Oscillator — a fast minus a slow average of this line
- On-Balance Volume — the older running total, signed by the close's direction instead of its place in the range
- Alerts — an alert when the line crosses a level you set
- Adding and tuning indicators