Simple Moving Average (SMA)
What the SMA measures, how to read its slope and crossings, its settings on MillionChart and a worked example on gold.
The Simple Moving Average (SMA) is the plain average of the last few closes, drawn as one line over the candles in the price's own units. It is the oldest and simplest way to smooth price: every candle in the window counts the same, so the line is calm and slow.
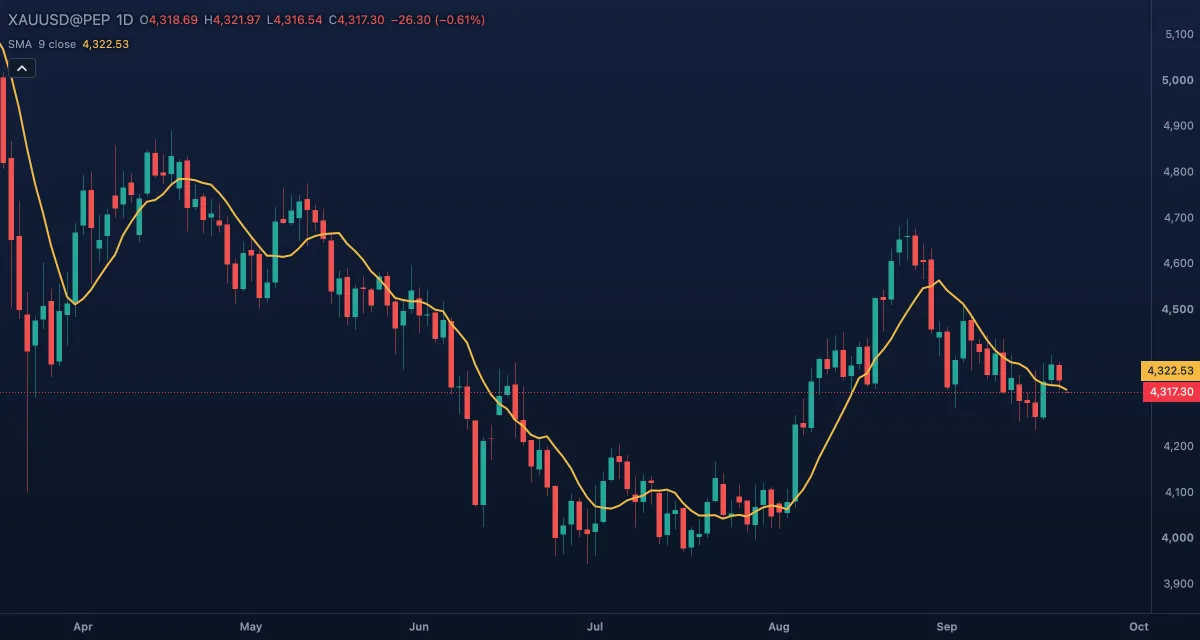
What it shows#
- SMA — one line over the candles; its legend chip reads
SMA 9 closewith the current value. - The line rises while the closes entering the window are higher than the ones leaving it, and falls when they are lower. Its slope is the trend of the last 9 candles, smoothed.
- Price above the line: the market is trading above its recent average. Price below: under it.
How it is calculated#
Add up the last 9 closes and divide by 9; move one candle forward and do it again. Length sets how many candles are added, Source which price is used (the close by default). The first value appears on the ninth candle, when the window is full. An old candle leaving the window moves the line as much as a new one entering it, which is why an SMA sometimes turns when nothing new happened.
How traders use it#
- The long ones are landmarks: the 50-, 100- and 200-period SMAs on the daily chart are watched by many traders, so price often reacts near them.
- Direction: a rising SMA with price above it is an up trend by the simplest definition; a flat SMA with price crossing it is a range.
- Crossings: a short SMA crossing a long one (the 50 above the 200 is the "golden cross", below it the "death cross") is a slow, widely followed signal.
- Distance: a close far above a long SMA marks a stretched market; a return toward the line is common, but a strong trend can stay stretched for weeks.
- Watch out for: lag. An SMA of 200 candles reacts to a reversal months after it started. It is a filter and a reference level, not a timing tool.
Settings#
| Setting | Default | What it changes |
|---|---|---|
| Length | 9 | The number of candles averaged, 1 to 5000. 20, 50 and 200 are the common choices on daily charts. |
| Source | Close | The price averaged: Open, High, Low, Close, Mid (HL2), Typical (HLC3) or Average (OHLC4). |
| Colours and style | — | The colour, width and dash of the SMA line. |
Example on gold#
Say you add two copies: the default SMA 9 and a second one set to 50. Gold has been rising for two months; the 50-period line sits near $4,200 and the 9-period near $4,320, both pointing up. For example, a drop to $4,210 that holds above the 50 and closes back over the 9 keeps the picture intact, and a trader might buy there with a stop under the 50. A daily close below $4,200, with the 9 crossing under the 50, would say the rise has ended for now. Nothing here predicts next week's prices; the lines only describe the past.
Add it to your chart#
- Click Indicators in the top strip.
- Type
smaand click the indicator, or press Enter for the first result.sma 200adds a 200-period line at once. - Click its chip in the legend to open the Inspector and change the settings; drag the chip to reorder; the dot hides it; × removes it.
Related#
- Exponential Moving Average — the same average weighted toward recent candles
- Weighted Moving Average — a linear weighting, between the two
- MA Cross — two SMAs (9 and 21) with a mark at each cross
- Adding and tuning indicators