Weighted Moving Average (WMA)
What the linearly weighted moving average measures, how it compares with SMA and EMA, its settings on MillionChart and an example on gold.
The Weighted Moving Average (WMA) is an average of the last few closes in which each candle counts a little more than the one before it: the newest has the heaviest weight, the oldest the lightest. It is one line over the candles, in price units, and it turns sooner than a simple average of the same length.
What it shows#
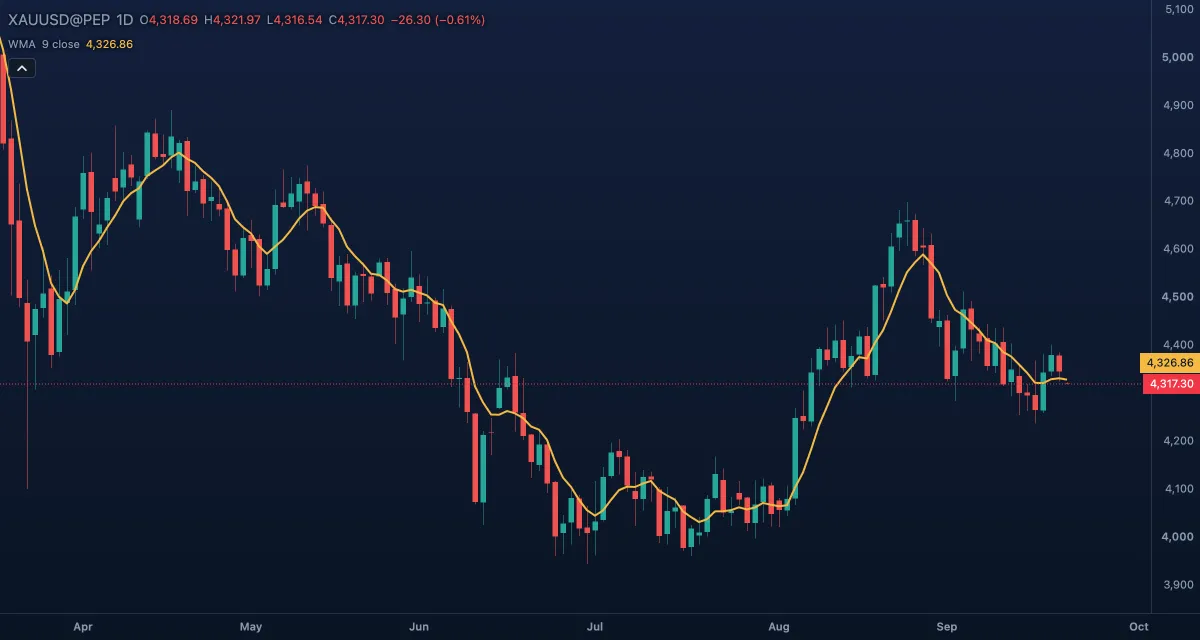
- WMA — one line over the candles; the legend chip reads
WMA 9 closeand its current value. - A rising line says the latest closes are above the weighted average of the window; a falling line, the opposite.
- Because the weights drop off in a straight line, the oldest candle hardly matters, so the line reacts to a turn faster than both the SMA and the EMA of the same length.
How it is calculated#
With a length of 9 the newest close is multiplied by 9, the one before by 8, and so on down to 1 for the oldest; the sum is divided by 9 + 8 + … + 1 = 45. The window moves forward one candle at a time, and the first value appears when nine candles are in it. Length sets the window, Source the price used (the close by default).
How traders use it#
- The same readings as any moving average: slope for direction, price above or below the line for bias, pullbacks to the line in a trend.
- It is a building block: the Hull Moving Average is made from three WMAs, which is where its speed comes from.
- Short WMAs (5 to 20) suit traders who want a fast line without the overshoot of a DEMA or a Hull.
- A cross of a short WMA over a long one is read like any MA cross, a few candles earlier than the SMA pair and with a few more false starts.
- Watch out for: speed costs smoothness. In a range the line wiggles with price and crosses it often.
Settings#
| Setting | Default | What it changes |
|---|---|---|
| Length | 9 | How many candles are weighted, 1 to 5000. |
| Source | Close | The price weighted: Open, High, Low, Close, Mid (HL2), Typical (HLC3) or Average (OHLC4). |
| Colours and style | — | The colour, width and dash of the WMA line. |
Example on gold#
Gold has been drifting up on the daily chart, from about $4,250 to $4,330 over three weeks, and the WMA 9 has stayed below the candles. For example, two red candles bring the close to $4,300, right on the line; a trader who follows the trend waits for the next candle. A close back above the WMA, with the line still rising, keeps the long idea alive; a close below it with the line turning flat is the cue to stand aside. The line gives a place to make the decision; it does not say which way the decision will go.
Add it to your chart#
- Click Indicators in the top strip.
- Type
wmaand click the indicator, or press Enter for the first result. - Click its chip in the legend to open the Inspector and change the settings; drag the chip to reorder; the dot hides it; × removes it.
Related#
- Simple Moving Average — equal weights; the slow reference
- Exponential Moving Average — weights that fade more gently and never reach zero
- Hull Moving Average — built from WMAs to cut the lag further
- Alerts — an alert when the price crosses the line
- Adding and tuning indicators