Chaikin Volatility
What Chaikin Volatility measures, how to read its swings around zero, its settings on MillionChart and an example on gold.
Chaikin Volatility measures how fast the size of the candles is changing. It takes an average of the high-to-low range of recent bars and reports its percentage change against ten bars ago, so it swings above and below zero. Marc Chaikin designed it; it uses only the high and the low of each bar.
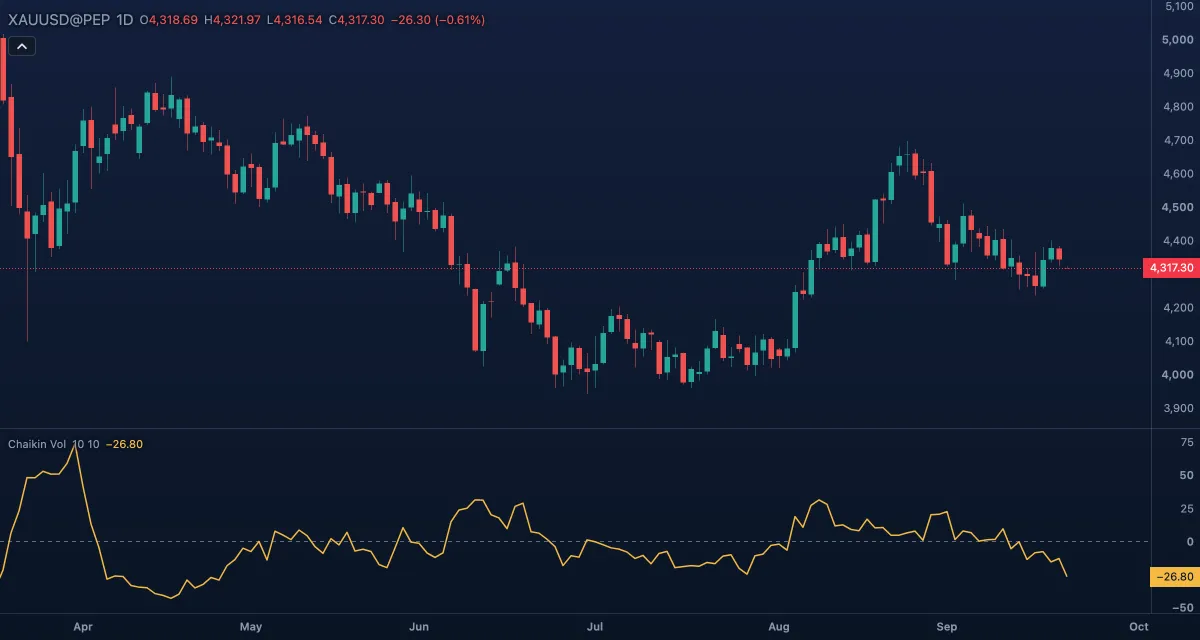
What it shows#
- CV — a line in its own pane, in percent. Above zero, the average candle is larger than it was ten bars ago (volatility expanding); below zero, smaller (contracting). The further from zero, the faster the change.
- Zero — a dashed level at 0. A cross upward marks the start of an expansion; a cross downward, the start of a contraction.
- There is no upper or lower limit, and no fixed "high" reading.
How it is calculated#
Each bar's range is its high minus its low. An exponential moving average over EMA length bars smooths that range. Chaikin Volatility is the rate of change of this average over ROC length bars: 100 × (average now − average ten bars ago) / average ten bars ago, at the defaults. The close and the volume do not enter it.
How traders use it#
- A sharp rise from a low reading, after a stretch of small candles, usually comes with the start of a move; a fall back toward zero says the move is settling.
- The reading usually quoted with it: a quick jump in volatility over a few bars often comes near a market low (panic selling), while a slow decline over many bars often precedes a top (a tired, orderly rise).
- As a filter: a breakout on which Chaikin Volatility crosses above zero has more force behind it than one made with shrinking candles.
- It says nothing about direction. Candles grow on the way down as readily as on the way up, so read the direction from the price or a trend indicator.
- Watch out for: it is smoothed twice, so it turns a few bars after the candles do, and it flips around zero often in a quiet range. Because the range is high minus low, a gap between one bar's close and the next bar's open is not counted; Average True Range includes gaps.
Settings#
| Setting | Default | What it changes |
|---|---|---|
| EMA length | 10 | Bars in the exponential average of the high–low range. Longer is smoother and slower. |
| ROC length | 10 | How many bars back the average is compared with. Longer measures a slower, larger swing. |
| Colours and style | — | The colours of the Chaikin volatility line and the Zero line. |
Example on gold#
For example, gold has drifted near $4,300 for three weeks and the daily ranges have shrunk from about $45 to about $20; Chaikin Volatility sits near −30. Then a $70 day closes at $4,360 and the line crosses zero upward over the next bars. The expansion supports the breakout: a long above the range with the stop under the quiet area at $4,270.
What would invalidate it: the line turning back under zero within a few days while the price returns to $4,300 — the wide candle was a single event, not the start of a move.
Add it to your chart#
- Click Indicators in the top strip (on the Pro screen, press I).
- Type
chaikinand click Chaikin Volatility. - Click its chip in the legend to open the Inspector and change the settings; drag the chip to reorder; the dot hides it; × removes it.
Related#
- Average True Range — the size of the candles in price units, gaps included
- Average Day Range — the typical range of a day
- Bollinger BandWidth — the width of the Bollinger Bands, another way to see expansion and contraction
- Alerts — an alert when the value crosses a level
- Adding and tuning indicators