SuperTrend
What SuperTrend draws, how its ATR bands flip direction, its settings on MillionChart and a worked example on gold.
SuperTrend is a trend-following stop line drawn over the candles: below price while the trend is up, above price while it is down. Its distance from price is a multiple of the Average True Range (ATR), a measure of how much the market moves per candle, so it sits further away in a wild market and closer in a quiet one.
What it shows#
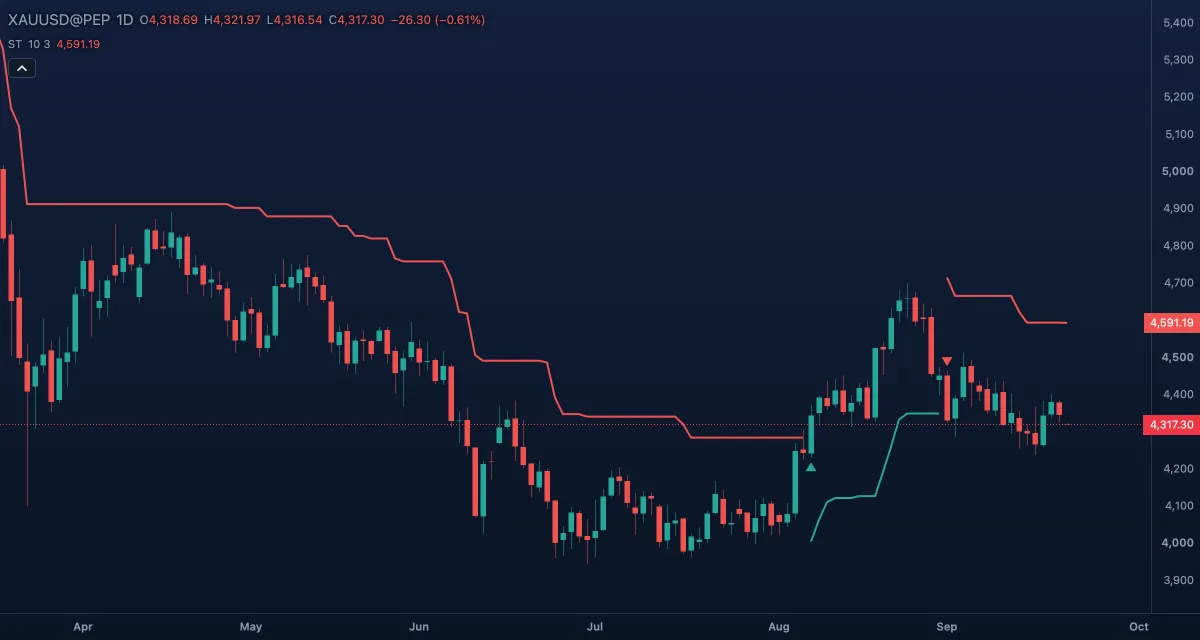
- SuperTrend — one stepped line over the candles: green under them in an up trend, red above them in a down trend. At a flip it jumps to the other side of price; the pieces are not joined.
- Flip up and Flip down — a small green triangle under the candle where the trend turned up, a small red one above the candle where it turned down. Mark direction flips turns them off.
How it is calculated#
The ATR over the ATR length (Wilder's smoothing of the true range) is multiplied by the ATR multiplier and added to and subtracted from the middle of the candle, (high + low) / 2, giving an upper and a lower band. The upper band may only fall and the lower band only rise, unless the previous close has crossed them, so the line ratchets with the trend. The trend is down until a close rises above the upper band, then up until a close falls below the lower band; the line is the lower band in an up trend and the upper band in a down trend.
How traders use it#
- The colour is the trend: buy only while the line is green, sell only while it is red.
- A flip is an entry or exit signal in itself, usually taken on the close of the flip candle.
- The line is a trailing stop: in a long trade it sits under price and moves up with it; a close below it ends the trade.
- A higher multiplier (4 or 5) means fewer flips and wider stops; a lower one (1.5 or 2) flips more often.
- Watch out for: in a sideways market it flips back and forth, and each flip costs money. It works in long trends and fails in ranges; ADX tells you which you are in.
Settings#
| Setting | Default | What it changes |
|---|---|---|
| ATR length | 10 | How many candles the ATR averages, 1 to 5000. Longer gives a steadier distance from price. |
| ATR multiplier | 3 | How many ATRs the line sits from the middle of the candle, 0.1 to 50. Larger means fewer flips and wider stops. |
| Mark direction flips | On | Draws the triangles on the candles where the trend turns. |
| Colours and style | — | The Up trend and Down trend colours of the line, the Flip up mark and Flip down mark colours, width and dash. |
Example on gold#
Suppose gold on the daily chart has been in an up trend, with SuperTrend green under the candles since a flip at about $4,120. With gold at $4,340 and a daily ATR near $45, the line sits around $4,205 and has risen with every new high. For example, a trader long from the flip keeps the stop at the line and ignores red candles that close above it. A close below $4,205 flips the line to red above price and prints a red triangle: the trade is closed, and only shorts are considered until the next green flip. In a sideways month the same rules would have flipped several times for small losses; that is the price of catching the long trends.
Add it to your chart#
- Click Indicators in the top strip.
- Type
supertrendand click the indicator, or press Enter for the first result. - Click its chip in the legend to open the Inspector and change the settings; drag the chip to reorder; the dot hides it; × removes it.
Related#
- Average True Range — the volatility measure behind the bands
- Parabolic SAR — dots that trail the trend and flip in a similar way
- Average Directional Index — tells a trend from a range before you trust the flips
- Alerts — an alert when the price crosses the line
- Adding and tuning indicators