Volume
What the volume columns and their moving average show, what the colours mean, how to read volume on gold on MillionChart, with an example.
Volume is how much trading went into each candle, drawn as a column in its own pane under the chart. It is the simplest volume indicator and the base of every other one in this group. On gold, forex and the other CFD symbols the volume is the broker's tick volume — how many price updates the candle had — not contracts traded.
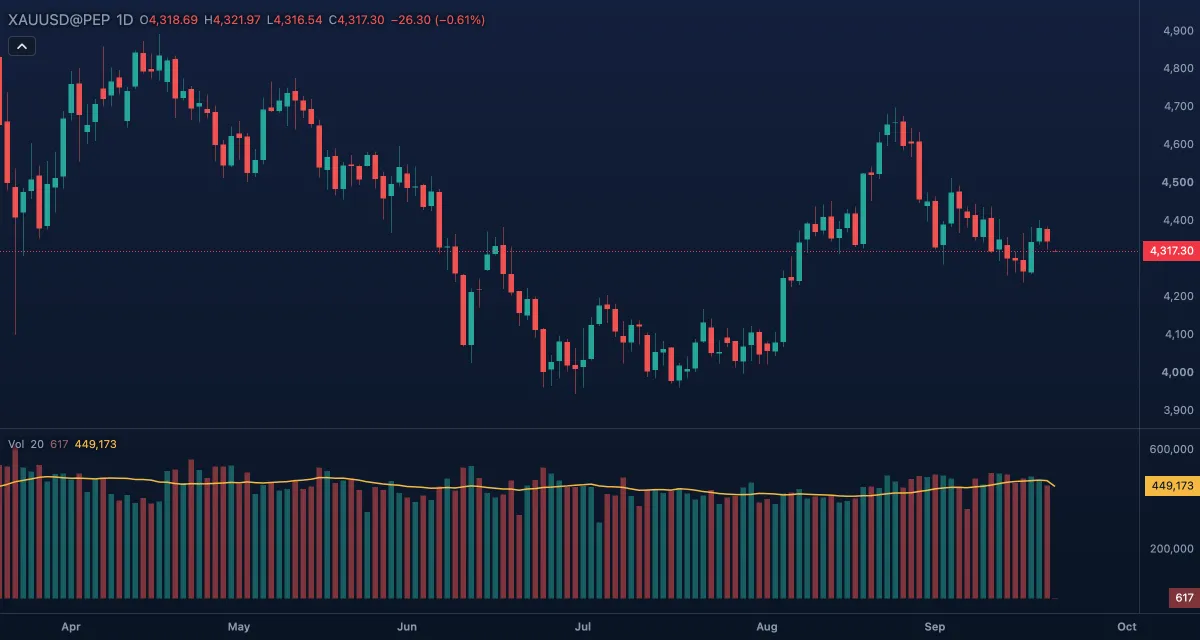
What it shows#
- Volume — one column per candle, in its own pane; the taller the column, the more activity. It takes the up colour (teal) when the candle closed at or above its open and the down colour (red) when it closed below, so the colour is the candle's direction, not "buying" or "selling" volume.
- Volume MA — a gold line, the simple moving average of the volume over MA length candles (20). A column above the line is a busier-than-usual candle; a run below it is a quiet stretch.
- The scale shows whole numbers.
How it is calculated#
Each column is the candle's volume as the feed reports it; nothing is smoothed. The colour is decided candle by candle: a close at or above the open counts as up, below it as down. The Volume MA is the plain average of the last MA length volumes, so it starts after that many candles. Turning Moving average off removes the line.
How traders use it#
- Confirmation: a breakout or a wide candle on a column well above the average has more participants behind it than the same move on thin volume.
- Climax: an unusually tall column after a long run often marks exhaustion — a reason to tighten stops, not a signal to trade against the move.
- Drying up: columns shrinking while price drifts sideways often come before a move; the direction is unknown until price breaks.
- Divergence: new price highs on shrinking columns are a caution; on growing columns they are healthier.
- Watch out for: tick volume measures activity, not money, and is not comparable between symbols or brokers; the last column grows while its candle is open; on a 1-minute chart the columns are noisy.
Settings#
| Setting | Default | What it changes |
|---|---|---|
| Moving average | On | Draws the Volume MA line; off removes it. |
| MA length | 20 | Candles in the average; longer gives a slower, flatter line. |
| Colours and style | — | Up volume and Down volume (the column colours) and MA (the line); widths and visibility under Lines in the Inspector. |
Example on gold#
Suppose gold has spent two weeks on daily candles between $4,250 and $4,320 and the columns have shrunk under the 20-day line. Then a daily candle closes at $4,345, above the range, on a column clearly above the line. For example, a trader who wants a breakout confirmed by volume takes this as the confirmation and plans a long with a stop under the range at $4,245.
What invalidates it: the next candles fall back inside the range on columns as tall or taller — a breakout that fails on heavy volume is a stronger warning than one that fails quietly.
Add it to your chart#
- Click Indicators in the top strip (on the Pro screen, press I).
- Type
voland click Volume, or press Enter. Volume is also under Quick add: one press adds it, another removes it. - Click its chip in the legend to open the Inspector and change the settings; drag the chip to reorder; the dot hides it; × removes it.
Related#
- On-Balance Volume — the same columns added up with the candle's sign
- Net Volume — each column signed by the candle's direction
- VWAP — the average price weighted by these columns
- Alerts — an alert when the value crosses a level
- Adding and tuning indicators