Directional Movement Index (DMI)
What +DI, −DI and ADX show together, how to read their crossings, the settings on MillionChart and a worked example on gold.
The Directional Movement Index is Wilder's full trend system in one pane: +DI measures upward movement, −DI measures downward movement, and ADX measures how strong the trend is whichever way it points. Together they answer two questions, "which way?" and "how strongly?". J. Welles Wilder Jr. published it in New Concepts in Technical Trading Systems (1978).
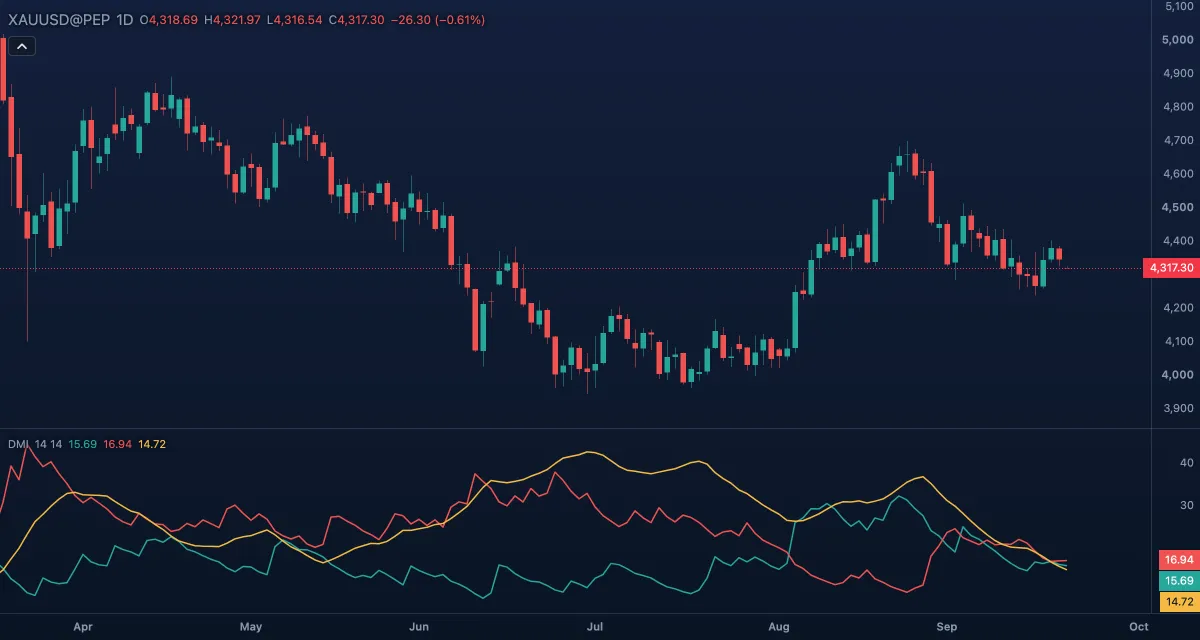
What it shows#
- +DI (green) — the share of recent movement that was upward, as a percentage of the true range. Rising means the up moves are growing.
- −DI (red) — the same for downward movement. Whichever line is on top says who is in charge.
- ADX (gold) — the strength of the trend: the smoothed, normalised gap between the two DI lines. It rises whether the trend is up or down.
- The pane draws no levels, so the three lines stay clear; the 25 level of the ADX page applies to the gold line here as well.
How it is calculated#
For each bar, +DM is how far the high rose above the previous high and −DM how far the low fell below the previous low; only the larger of the two counts, and only when it is positive. +DI = 100 × smoothed(+DM) / smoothed(true range) and −DI likewise, both with Wilder's smoothing over the DI length. DX = 100 × |+DI − −DI| / (+DI + −DI), and ADX is DX smoothed over ADX smoothing.
How traders use it#
- Direction: +DI above −DI is a market where the up moves are winning; −DI above +DI, the down moves.
- Wilder's entry: when +DI crosses above −DI, buy if price takes out the high of the crossing bar; the mirror for a cross down. The extreme of that bar is the stop.
- Filter with ADX: a DI cross with ADX above 25, or rising, is worth more than one with ADX flat under 20, where the lines cross back and forth.
- Watch out: all three lines lag, since each one is smoothed and ADX is smoothed twice. In a range the DI lines cross often, and most of those crossings are noise.
Settings#
| Setting | Default | What it changes |
|---|---|---|
| DI length | 14 | The smoothing of +DM, −DM and the true range that makes +DI and −DI (1 to 5,000). |
| ADX smoothing | 14 | The smoothing of DX into ADX (1 to 5,000). |
| Colours and style | — | The +DI, −DI and ADX line colours. |
Example on gold#
Gold bottoms near $4,200 after a two-week slide. On the daily DMI (14, 14) the −DI line, which had been on top at 35, falls while +DI rises, and the two cross with ADX at 30, still high from the slide. For example, a trader marks the high of the crossing day, about $4,235, and buys only if the next days trade above it, with the crossing day's low as the stop.
What would invalidate it: price failing to take out that high and −DI crossing back above +DI within a few bars. Then the slide was paused, not finished, and the ADX that is still high belongs to the downtrend.
Add it to your chart#
- Click Indicators in the top strip (on the Pro screen, I does the same).
- Type
dmiand click the indicator. - Click its chip in the legend to open the Inspector and change the settings; drag the chip to reorder; the dot hides it; × removes it.
Related#
- Average Directional Index — the ADX line on its own, with the 25 level drawn
- Parabolic SAR — Wilder's trailing stop, often paired with a DI cross
- Average True Range — the true range the DI lines are divided by
- Alerts — an alert when +DI crosses −DI
- Adding and tuning indicators