Momentum
What the Momentum indicator measures, how to read its zero line and slope, its settings on MillionChart and an example on gold.
Momentum is the simplest momentum indicator: the price now minus the price a set number of bars ago. A positive value means the price is higher than it was then, a negative value lower, and the size of the value is how far it has moved. It is measured in the symbol's price units — on gold, dollars — and has no fixed range. It is a textbook indicator with no single credited author.
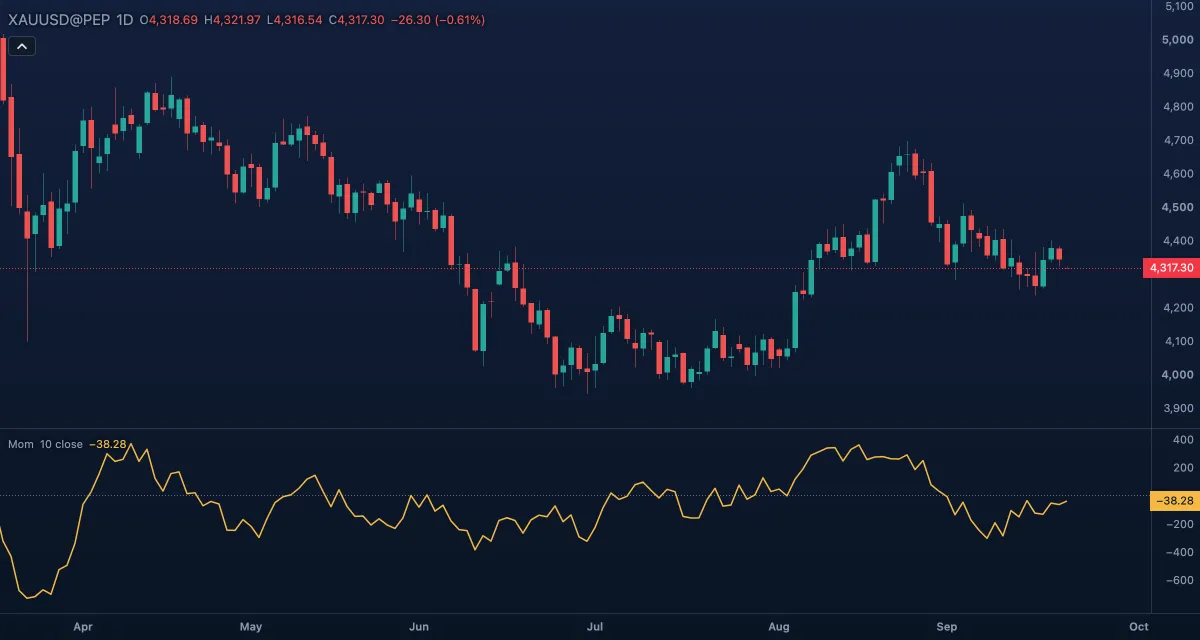
What it shows#
- Momentum — one line in its own pane. Rising means the price is gaining on where it was Length bars ago; falling means it is losing that lead. The line can rise while the price falls, if the price fell faster ten bars ago.
- Zero — a dotted line at zero: the price is exactly where it was Length bars ago.
How it is calculated#
Momentum = the Source of this bar minus the Source of the bar Length bars earlier (10 by default). Nothing is averaged or scaled. The first bars of the history, as many as the length, have no value.
How traders use it#
- The zero cross: the line rising above zero says the price is higher than ten bars ago — an uptrend by the simplest definition; falling below zero, a downtrend.
- The slope: momentum rising while above zero is a move gaining speed; momentum flattening and turning down while still above zero is a move slowing, often before the price turns.
- Extremes: a reading far from zero by the standard of recent months marks an overstretched move; there is no fixed level on an unbounded line.
- Divergence: a new price high with a lower momentum peak says the latest leg covered less ground than the previous one.
- Watch out for the drop-off effect: the line depends as much on the bar leaving the window as on today's bar — a big up day ten bars ago falling out drops the line even if today's price is unchanged. Rate of Change shares this; smoothed oscillators such as RSI and MACD do not.
Settings#
| Setting | Default | What it changes |
|---|---|---|
| Length | 10 | How many bars back the comparison reaches. Shorter is faster and noisier; longer follows the bigger swings. |
| Source | Close | Which price is measured: Open, High, Low, Close, Mid (HL2), Typical (HLC3) or Average (OHLC4). |
| Colours and style | — | The colours of the Momentum line and the Zero line; width and dash under Look in the Inspector. |
Example on gold#
Gold rises, for example, from $4,200 to $4,320 over two weeks on the daily chart, and Momentum (10, close) climbs to about +100: the price is $100 above where it was ten trading days ago. Over the next days the price edges to $4,335 but momentum falls to +60 — each day now adds less than the day dropping out of the window. The rise is slowing. A trader holding a long position raises the stop to the last swing low near $4,280; one who wants to buy waits for momentum to dip towards zero and turn up again with the price still above that low.
What would invalidate the caution: momentum turning up to a new high above +100 along with the price — the move has found new speed.
Add it to your chart#
- Click Indicators in the top strip (on the Pro screen, press I).
- Type
momand click the indicator, or press Enter for the first result. - Click its chip in the legend to open the Inspector and change the settings; drag the chip to reorder; the dot hides it; × removes it.
Related#
- Rate of Change — the same change in percent, comparable across symbols
- Chande Momentum Oscillator — up moves against down moves, on a fixed −100 to +100 scale
- RSI — smoothed momentum with fixed levels
- Alerts — an alert when momentum crosses zero
- Adding and tuning indicators