Chaikin Oscillator
What the Chaikin Oscillator measures, how it takes the momentum of the A/D line, its settings on MillionChart and an example on gold.
The Chaikin Oscillator is the momentum of the Accumulation/Distribution Line: a fast exponential average of that line minus a slow one, 3 and 10 candles by default. Positive values mean the A/D line has been rising lately, so accumulation is speeding up; negative values mean it has been falling. Marc Chaikin devised it as the companion of his A/D line. It has no fixed range.
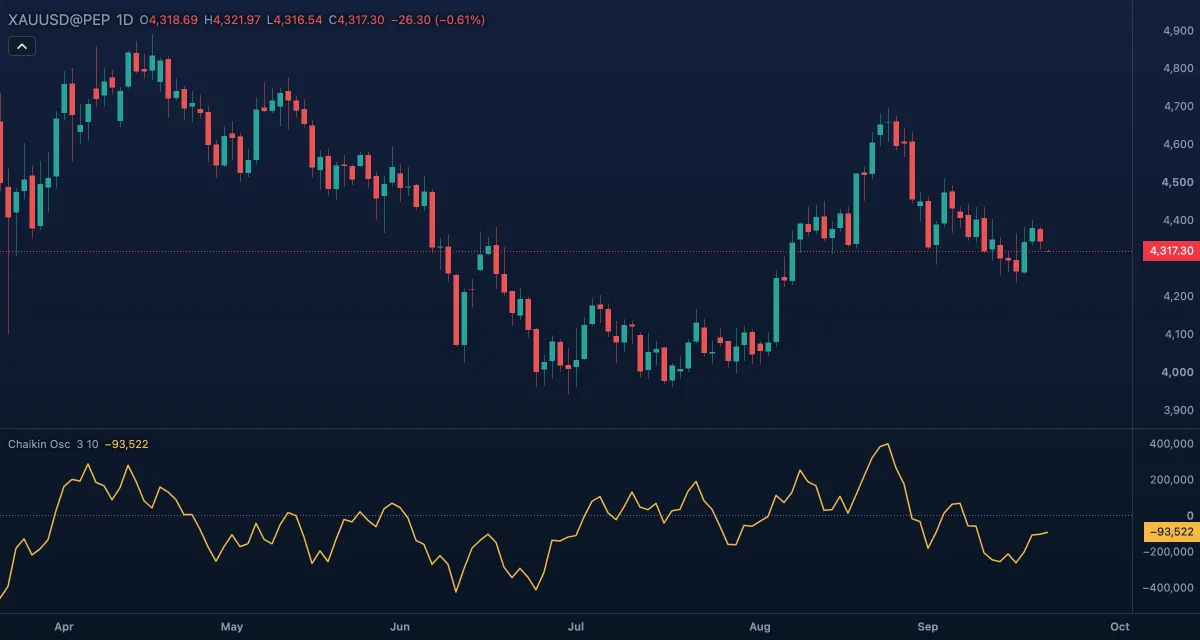
What it shows#
- Chaikin Osc — a gold line in its own pane: EMA 3 minus EMA 10 of the A/D line. Rising above zero, volume-weighted buying is accelerating; falling below zero, selling. Its peaks and troughs come at or before the turns of the A/D line.
- Zero — a dotted line. Crossings are the classic signal.
- The scale is in volume units without decimals; the numbers are large and symbol-specific, so read crossings and divergences, not values.
How it is calculated#
First the A/D line: each candle adds volume × ((close − low) − (high − close)) / (high − low) to a running total. Then the oscillator = EMA(A/D, Fast length) − EMA(A/D, Slow length). With the defaults 3 and 10 the first value lands after 10 candles, and the averages have settled after about 30.
How traders use it#
- Zero crossings: crossing above zero is the buy reading, below zero the sell reading. With the defaults these are frequent, so most traders take them only in the direction of a longer trend.
- Divergence: price makes a new low while the oscillator makes a higher low — selling pressure is fading. This is the reading Chaikin stressed; the mirror applies at highs.
- Confirmation: a breakout with the oscillator pushing to a new high says the volume-weighted closes are behind it.
- Slower settings, for example 6 and 20, cut the whipsaws at the cost of lag.
- Watch out for: 3 and 10 are short, so the line whipsaws in a range; it inherits the A/D line's blindness to gaps; one huge-volume candle dominates it for a couple of weeks; tick volume on gold and forex.
Settings#
| Setting | Default | What it changes |
|---|---|---|
| Fast length | 3 | The fast EMA of the A/D line. |
| Slow length | 10 | The slow EMA; the oscillator is fast minus slow. |
| Colours and style | — | Oscillator (the line) and Zero line; width and visibility under Lines in the Inspector. |
Example on gold#
Suppose gold on daily candles falls from $4,330 to $4,270, then a week later to $4,255 — but the oscillator's low on the second dip is clearly higher than on the first, while price went lower. For example, a trader reads this bullish divergence as selling pressure fading and waits for the oscillator to cross above zero; when it does, with price back at $4,275, they buy with a stop under $4,250.
What invalidates it: the oscillator failing to hold above zero and price closing under $4,250 — the fading pressure has returned, and the setup is gone.
Add it to your chart#
- Click Indicators in the top strip (on the Pro screen, press I).
- Type
chaikinand click Chaikin Oscillator — the search also lists Chaikin Money Flow and Chaikin Volatility, so pick the oscillator. - Click its chip in the legend to open the Inspector and change the settings; drag the chip to reorder; the dot hides it; × removes it.
Related#
- Accumulation/Distribution Line — the line this is the momentum of
- Chaikin Money Flow — the windowed ratio form of the same idea
- MACD — the same fast-minus-slow construction on price
- Alerts — an alert when the value crosses zero
- Adding and tuning indicators