Historical Volatility (HV)
What historical volatility measures, how MillionChart annualises it per market, how to read it, its settings and an example on gold.
Historical volatility (also called realised or statistical volatility) measures how much the close has moved from bar to bar over a recent window, scaled up to a yearly figure in percent. It is the number options traders set against implied volatility. A reading of 15 says that the recent pace of daily changes, carried on for a year, amounts to a typical swing of about 15% of the price (one standard deviation).
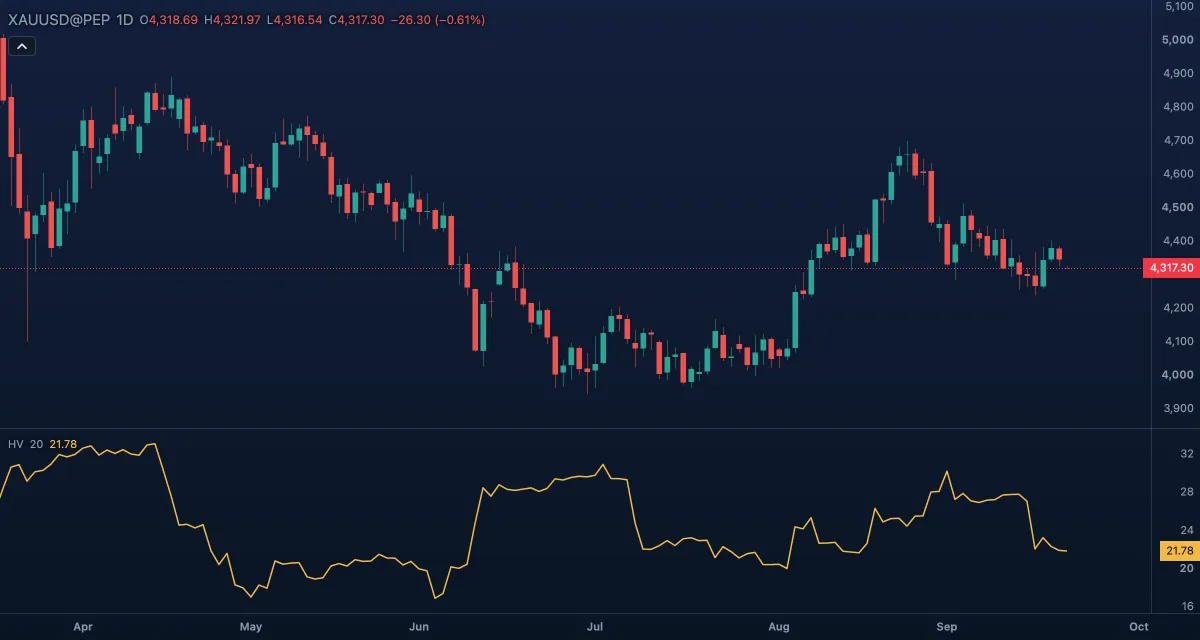
What it shows#
- HV — a line in its own pane, in percent per year. Rising means the bar-to-bar changes are getting larger; falling means the market is calming.
- There are no fixed levels. Read it against its own past: where it stands between its lows and highs of the last months.
How it is calculated#
For every bar the indicator takes the logarithmic return, ln(close ÷ previous close). The standard deviation of the last Length returns is multiplied by the square root of the number of bars in a trading year, and by 100. Year basis Auto takes that number from the symbol's type: crypto 365 days of 24 hours; stocks 252 days of 6.5 hours; metals, energy and indices 252 days of 23 hours; forex and everything else 252 days of 24 hours. On daily candles a day is one bar, so gold uses 252; on a 1-hour chart gold uses 252 × 23 bars. Custom takes the two numbers from the settings below.
How traders use it#
- Low HV against the last months means a quiet market. Quiet stretches often end in lively ones, but HV says neither when nor in which direction.
- Position size: a symbol with twice the HV wants about half the size for the same risk in money, and stops set in percent should scale with it.
- Options: when implied volatility stands well above historical, options are expensive relative to how the price has actually moved; well below, cheap.
- Volatility has no direction: HV rises in a sharp rally as much as in a sell-off.
- Watch out for: one huge day stays in the window for 20 bars and then drops out all at once, so a sudden step down in HV is the window, not the market.
Settings#
| Setting | Default | What it changes |
|---|---|---|
| Length | 20 | Bars (returns) in the standard deviation; about one trading month on daily candles. |
| Year basis | Auto | Auto picks the days and hours per year from the symbol's type (see above); Custom uses the next two settings. |
| Custom days per year | 252 | Trading days in a year, used when the year basis is Custom. |
| Custom session hours per day | 24 | Trading hours in a day, used when the year basis is Custom. It only matters on intraday timeframes. |
| Colours and style | — | The colour of the Historical volatility line. |
Example on gold#
For example, after a quiet summer gold trades near $4,300 and HV (20) reads 10, close to its low of the year: a typical day moves about 0.6% (10 ÷ √252), or about $27. Two weeks later the market swings $80 a day and HV reaches 22: a typical day is now about 1.4%, or $60. A $30 stop that was reasonable at HV 10 is inside a single day's noise at HV 22, so the trader widens it and halves the position to keep the same money at risk.
What would change the reading: HV falling back under 15 as the wide days leave the window — a sign the burst is over, not a signal of direction.
Add it to your chart#
- Click Indicators in the top strip (on the Pro screen, press I).
- Type
hvand click Historical Volatility. - Click its chip in the legend to open the Inspector and change the settings; drag the chip to reorder; the dot hides it; × removes it.
Related#
- Average True Range — volatility in price units, the usual base for stops
- Standard Deviation — the same statistic on the price itself, not annualised
- Bollinger BandWidth — volatility as the width of the bands
- Alerts — an alert when the value crosses a level
- Adding and tuning indicators