Elder Force Index (EFI)
What the Force Index measures, how price change and volume combine in it, its settings on MillionChart and an example on gold.
The Force Index measures the force behind a move: how much price changed in the candle, times the volume that moved it. Positive values are buying force, negative values selling force, and the size is the strength. Alexander Elder published it in Trading for a Living (1993). It has no fixed range; its scale follows the symbol's price and volume.
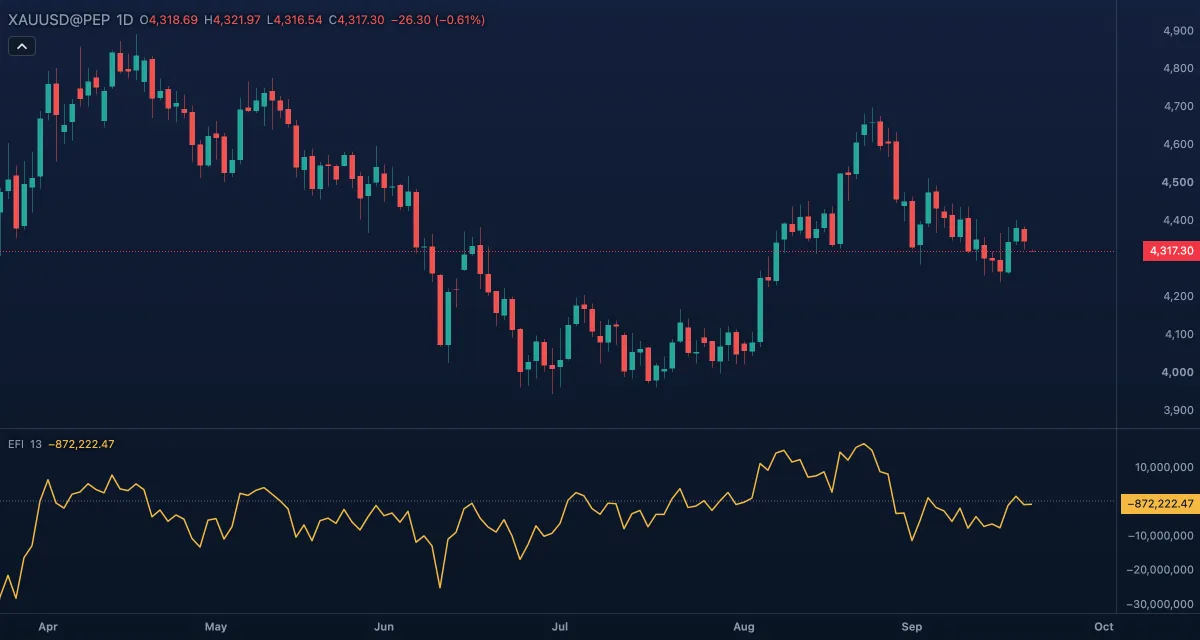
What it shows#
- EFI — a gold line in its own pane: the 13-candle exponential average of the one-candle force. Above zero the buyers have had the upper hand over the last couple of weeks of daily candles; below zero the sellers.
- Zero — a dotted line; crossings and dips to it are the main readings.
- Values are shown with the symbol's own decimals. On gold they are large numbers and on a currency pair they stay below 1, so read the shape, not the number.
How it is calculated#
For each candle, force = (close − previous close) × volume, and EFI = EMA(force, Length). With the default 13 the first value appears on the 14th candle, and the average has settled after about 40. Elder used 2 for a short-term reading and 13 for an intermediate-term one.
How traders use it#
- Trend confirmation: a new price high with a new EFI high says the advance has force behind it; a new price high with a lower EFI peak (divergence) says it is tiring.
- Pullback entries: in an uptrend, judged by a moving average, EFI dipping below zero and turning up marks a pullback that buyers are reclaiming; the mirror in a downtrend.
- Spikes: an unusually large reading in either direction often marks a climax; a pause is more likely than another leg of the same size.
- Watch out for: EFI is unbounded, so there are no overbought and oversold levels; one huge-volume candle dominates the line for several candles; on gold and forex the volume is tick volume, so the force is weighted by activity, not money.
Settings#
| Setting | Default | What it changes |
|---|---|---|
| Length | 13 | Candles in the exponential average. 2 gives the short-term, spiky version; 13 the intermediate one; longer is smoother and slower. |
| Colours and style | — | Force index (the line) and Zero line; width and visibility under Lines in the Inspector. |
Example on gold#
Suppose gold on daily candles is in an uptrend above its 50-day average and has pulled back from $4,340 to $4,290 over a week; EFI dipped below zero during the pullback. For example, when a daily candle closes up at $4,305 and EFI turns up through zero, a trader treats it as the pullback ending with buyers back in force, and enters long with a stop under the pullback low at $4,285 and the prior high as the target.
What invalidates it: EFI rolling back under zero on a wide down candle; or price pushing to a new high at $4,360 while the EFI peak stays below the previous one — the force is fading, and the trader tightens the stop instead of adding.
Add it to your chart#
- Click Indicators in the top strip (on the Pro screen, press I).
- Type
efiand click Elder Force Index, or press Enter for the first result. - Click its chip in the legend to open the Inspector and change the settings; drag the chip to reorder; the dot hides it; × removes it.
Related#
- Ease of Movement — distance per unit of volume, the complementary question
- On-Balance Volume — volume signed by the close's direction, without the size of the change
- Exponential Moving Average — the trend filter to read the force against
- Alerts — an alert when the value crosses zero
- Adding and tuning indicators