Schaff Trend Cycle (STC)
What the Schaff Trend Cycle measures, how to read its 0 to 100 line, its settings on MillionChart and a worked example on gold.
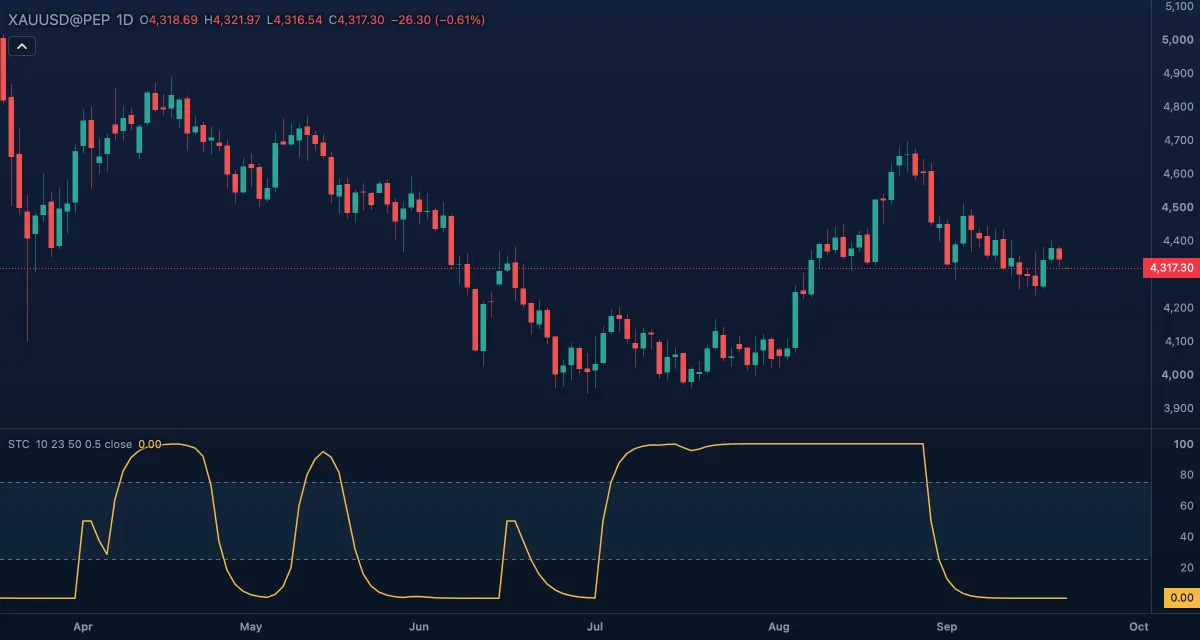
The Schaff Trend Cycle (STC) is a faster, smoother reading of MACD: it runs the MACD line through a stochastic twice, so the result swings between 0 and 100 and turns early when a trend starts or ends. It is drawn in its own pane with levels at 25 and 75. Doug Schaff designed it to add cycle timing to a trend indicator.
What it shows#
- STC — one line in its own pane on a fixed 0 to 100 scale. Near 100 the MACD line is at the top of its recent range, near 0 at the bottom. The line typically runs flat along 100 or 0 while a trend continues and crosses the levels when the cycle turns.
- Upper and Lower — dashed levels at 75 and 25, with a light Zone fill between them.
How it is calculated#
First a MACD line: the exponential moving average of the Source over the Fast length (23) minus the one over the Slow length (50). Then a stochastic of that line over the Cycle length (10 bars) — where the MACD sits between its lowest and highest value of the window, from 0 to 100 — smoothed with the Smoothing factor (0.5: each bar moves half-way to the new value). The same pass is applied a second time, and the result is the STC. While the MACD window is flat the stochastic keeps its last value; with the defaults the line needs roughly 70 bars of history before its first value.
How traders use it#
- STC rising through 25 is read as the start of an up cycle (the buy signal of Schaff's method); falling through 75 as the start of a down cycle.
- A line pinned near 100 or 0 means the trend is still running; the signal comes when it leaves the extreme, not while it sits there.
- Many traders take only the signals in the direction of a longer trend filter, such as a 200-bar moving average.
- Watch out for: in a sideways market the line races between 0 and 100 and gives signals that go nowhere, and a sharp reversal shows up a few bars late.
Settings#
| Setting | Default | What it changes |
|---|---|---|
| Cycle length | 10 | Bars of each stochastic window; shorter reacts faster |
| Fast length | 23 | The fast exponential average of the MACD line underneath |
| Slow length | 50 | The slow exponential average of the MACD line |
| Smoothing factor | 0.5 | How far each bar moves toward the new stochastic value (0.01 to 1); lower is smoother and slower |
| Source | Close | The price the MACD is built on: Close, Open, High, Low, Mid, Typical or Average |
| Colours and style | — | The colour of the STC line, of the Upper level and Lower level and of the Zone fill between them |
Example on gold#
Imagine gold has fallen for three weeks from $4,400 toward $4,250 and the STC has sat near 0 the whole time. Price steadies for a few days and the STC rises through 25. For example, a trader looking for the end of the correction could read that as the first sign of a new up cycle and look for an entry near $4,260 with a stop under the $4,240 low. The STC rolling back below 25 within a few bars, or price breaking the low, would mean the signal failed.
Add it to your chart#
- Click Indicators in the top strip (on the Pro screen you can press I).
- Type
stcand click the indicator. - Click its chip in the legend to open the Inspector and change the settings; drag the chip to reorder; the dot hides it; × removes it.
Related#
- MACD — the line the STC is built from
- Stochastic — the same position-in-range idea applied to price
- Stochastic RSI — a stochastic of another indicator, the RSI
- Alerts — an alert when the value crosses a level
- Adding and tuning indicators