Know Sure Thing (KST)
What the Know Sure Thing measures, how to read its two lines, its settings on MillionChart and a worked example on gold.
The Know Sure Thing (KST) is a momentum indicator that adds up four rates of change of different lengths, each one smoothed, so that short swings and long swings both count. It is drawn in its own pane around a zero line, in percent-like units with no fixed bounds. Martin Pring published it in 1992.
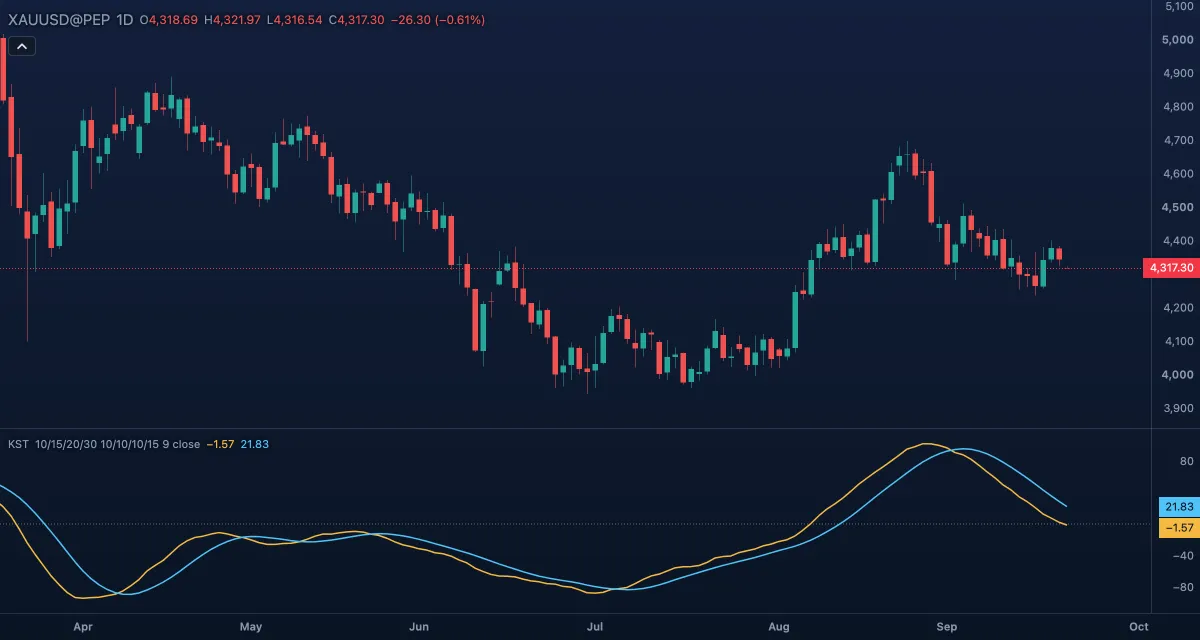
What it shows#
- KST — the main line, in its own pane. Rising means momentum is building across the four lengths, falling means it is fading.
- Signal — a 9-bar simple moving average of the KST. The two lines crossing is the classic reading.
- Zero — a dotted level at 0.
How it is calculated#
Four rates of change (ROC: the percent change of price over a number of bars) are taken on the Source over the four ROC lengths (10, 15, 20 and 30 bars), and each is smoothed with a simple moving average of its own SMA length (10, 10, 10 and 15). The four lines are added with the weights 1, 2, 3 and 4, so the longest counts four times as much as the shortest; the weights are part of Pring's definition and are not settings. The Signal is a simple moving average of the KST over the Signal length.
How traders use it#
- KST crossing above its signal line is read as momentum turning up, crossing below as turning down — a confirmation, not an entry on its own.
- Above zero and rising supports a long bias; below zero and falling, a short bias.
- A new high in price with a lower high on the KST (or a new low with a higher KST low) is a divergence that warns the move is losing force.
- Watch out for: the smoothing makes KST slow. Its crossings arrive well after a turn, and in a sideways market they come one after another in both directions.
Settings#
| Setting | Default | What it changes |
|---|---|---|
| ROC length 1 | 10 | Bars of the first, shortest rate of change |
| ROC length 2 | 15 | Bars of the second rate of change |
| ROC length 3 | 20 | Bars of the third rate of change |
| ROC length 4 | 30 | Bars of the fourth, longest rate of change (weighted four times) |
| SMA length 1 | 10 | Smoothing of the first rate of change |
| SMA length 2 | 10 | Smoothing of the second |
| SMA length 3 | 10 | Smoothing of the third |
| SMA length 4 | 15 | Smoothing of the fourth |
| Signal length | 9 | Bars of the simple moving average that makes the signal line |
| Source | Close | The price the rates of change are taken on: Close, Open, High, Low, Mid, Typical or Average |
| Colours and style | — | The colours of the KST and Signal lines and of the Zero line |
Example on gold#
Suppose gold has climbed for two months and trades near $4,300 on the daily chart. Price makes a slightly higher high at $4,320 while the KST makes a lower high: a bearish divergence — the move is still up, but it is losing momentum. For example, a trader who is long might tighten a stop rather than add, and treat the KST crossing below its signal line as confirmation of the slowdown. The KST turning up to a new high above its last peak would invalidate the warning.
Add it to your chart#
- Click Indicators in the top strip (on the Pro screen you can press I).
- Type
kstand click the indicator. - Click its chip in the legend to open the Inspector and change the settings; drag the chip to reorder; the dot hides it; × removes it.
Related#
- Rate of Change — the single rate of change the KST is built from
- Coppock Curve — an older indicator that also averages summed rates of change
- MACD — a faster momentum line with a signal line
- Alerts — an alert when the value crosses a level
- Adding and tuning indicators