Hull Moving Average (HMA)
What the Hull Moving Average is, why it is fast and smooth at once, its settings on MillionChart and a worked example on gold.
The Hull Moving Average (HMA) is a moving average built to be both smooth and quick: it follows turns in price almost at once, yet draws a clean curve. It is one line over the candles, in price units. Alan Hull published it in 2005.
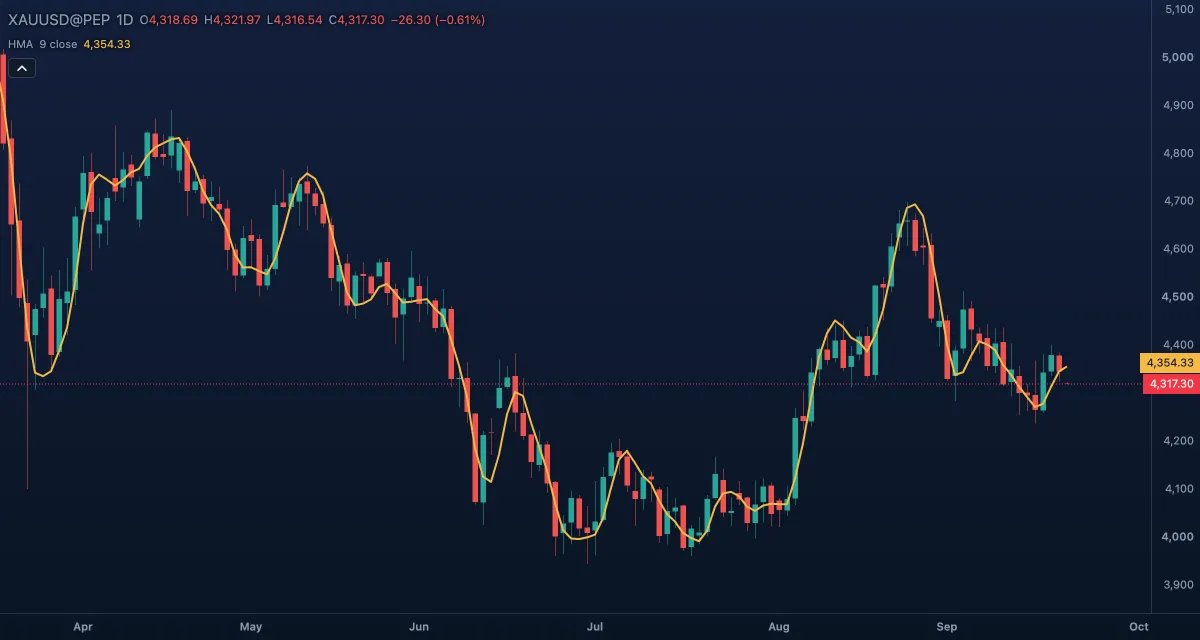
What it shows#
- HMA — one curved line over the candles; the legend chip reads
HMA 9 closeand the current value. - The line's direction is its main message: it turns up and down close to where price does, with little of the delay of a simple or exponential average.
- Price is often on the line rather than clearly above or below it, so the slope is read more than the side.
How it is calculated#
Three weighted moving averages are combined: a WMA over half the Length and a WMA over the full length; double the short one and subtract the long one, which removes most of the lag and adds some noise; then smooth the result with a WMA over the square root of the length, which takes the noise back out. With the default length of 9 the three windows are 4, 9 and 3 candles (the half length rounded down, the square root to the nearest whole number). The Source is the price used, the close by default.
How traders use it#
- Slope: a turn of the HMA from falling to rising is read as a short-term bottom, the reverse as a top. Many traders colour the line by slope and act on the colour change.
- As a fast trailing line: in a trend, price rides the HMA with the line pointing the same way; a close across it against the slope is the warning.
- Longer settings (20 to 55) make a calm trend line that still turns weeks before a simple average of the same length.
- Watch out for: overshoot. The lag correction pushes the line past price after a sharp move, so the HMA can sit above the high of a spike. And like every average it turns late in a slow, grinding reversal.
Settings#
| Setting | Default | What it changes |
|---|---|---|
| Length | 9 | The window of the long WMA, 1 to 5000; the other two windows are half of it and its square root. |
| Source | Close | The price smoothed: Open, High, Low, Close, Mid (HL2), Typical (HLC3) or Average (OHLC4). |
| Colours and style | — | The colour, width and dash of the HMA line. |
Example on gold#
Picture gold falling from $4,400 to $4,250 on the daily chart over three weeks, with the HMA 9 running down above the candles. For example, two days of higher closes bend the line flat and then up at about $4,265; a trader who uses the slope as the signal buys the next close above the line, with the invalidation a close back under a falling HMA. If gold closes at $4,240 three days later with the HMA pointing down again, the signal was a whipsaw, and the small loss is the only consolation. On a longer length, 21 for instance, the same bounce might not have turned the line at all.
Add it to your chart#
- Click Indicators in the top strip.
- Type
hmaand click the indicator, or press Enter for the first result. - Click its chip in the legend to open the Inspector and change the settings; drag the chip to reorder; the dot hides it; × removes it.
Related#
- Weighted Moving Average — the building block of the HMA
- Double Exponential Moving Average — another low-lag average, from EMAs
- Arnaud Legoux Moving Average — low lag with a bell-shaped window
- Alerts — an alert when the price crosses the line
- Adding and tuning indicators