On-Balance Volume (OBV)
What On-Balance Volume measures, how to read its direction and its divergences, its settings on MillionChart and a worked example on gold.
On-Balance Volume (OBV) is a running total of volume: each bar's volume is added when the bar closes above the previous close and subtracted when it closes below it. The line has no fixed range and its level depends on where your loaded history starts, so only its direction and shape matter. Joseph Granville published it in 1963.
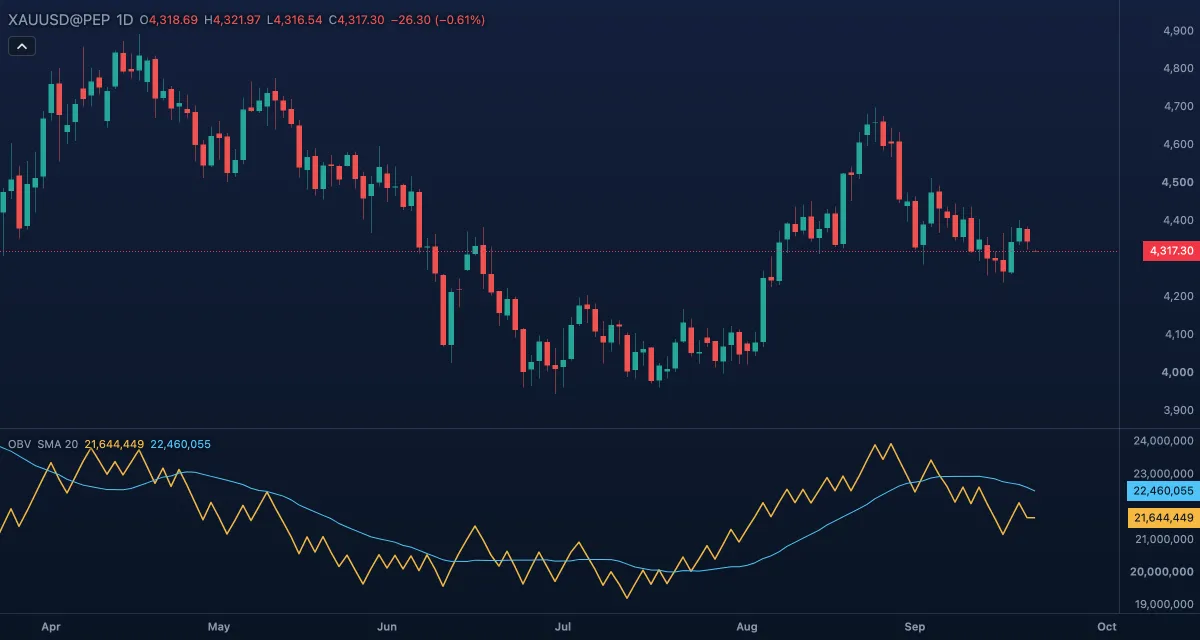
What it shows#
- OBV — a line in its own pane under the chart. It rises while more volume goes into up-closes than into down-closes, and falls when the opposite is true. A line that disagrees with price is the warning Granville looked for.
- OBV MA — a moving average of the line, a 20-bar simple moving average (SMA) by default. It is not part of Granville's definition; MillionChart adds it so you can read the line's trend against something.
How it is calculated#
The line starts on the first bar that has a close and a volume. On each later bar, a close above the previous close adds the bar's volume, a close below subtracts it, and an unchanged close adds nothing. A bar with a missing close or volume adds nothing and the line carries its value over it. The average is an SMA or EMA of the line over MA length. On gold and other CFD or forex symbols the volume is the broker's tick volume (the number of price changes in the bar), not contracts traded.
How traders use it#
- Confirmation: in a healthy rise OBV makes higher highs along with price. Price at a new high with OBV below its last high is a bearish divergence — the rise has less volume behind it; the mirror image at lows is a bullish one.
- OBV breaking out of its own range before price does is read as volume leading price; some traders draw trend lines and support levels on OBV as they would on price.
- The line above a rising OBV MA is a simple filter for the direction of the volume flow; crosses of the average mark changes in it.
- Watch out for one huge bar: it shifts the line for good and can hide everything around it. The absolute value means nothing, OBV says nothing about how far price may go, and a divergence can last a long time before price answers it.
Settings#
| Setting | Default | What it changes |
|---|---|---|
| Moving average | On | Draws the average of the line. Off leaves OBV on its own. |
| MA type | SMA | SMA or EMA of the line. The EMA follows turns sooner. |
| MA length | 20 | The bars of the average. Longer is smoother and slower. |
| Colours and style | — | The colours of the OBV line and of the MA line. |
Example on gold#
For example, gold on daily candles climbs from about $4,200 to a high near $4,350, pulls back, and then pushes to a marginal new high at $4,360. OBV made its high on the first push and is clearly lower on the second one, under its 20-bar average: the second high came on less volume. A trader holding a long position takes this as a reason to tighten the stop rather than add, and waits for a break of $4,300 before calling the rise over. A new OBV high above the first peak would invalidate the warning.
Add it to your chart#
- Click Indicators in the top strip (on the Pro screen the key is I).
- Type
obvand click the indicator. - Click its chip in the legend to open the Inspector and change the settings; drag the chip to reorder; the dot hides it; × removes it.
Related#
- Accumulation/Distribution Line — a running total that weighs where the bar closed inside its range
- Price Volume Trend — the same idea weighted by the size of the price change
- Net Volume — the single bars OBV adds up
- Alerts — an alert when OBV crosses its average
- Adding and tuning indicators