Williams Vix Fix (WVF)
What the Williams Vix Fix measures — a fear gauge built from price alone — how its spikes mark possible lows, its settings and an example on gold.
The Williams Vix Fix rebuilds the idea of the VIX, the fear gauge of the US stock market, from a symbol's own prices, so it works on gold, forex or crypto, where there is no options market to read fear from. It measures how far the bar's low has fallen below the highest close of the last 22 bars, in percent. Larry Williams published it in Active Trader in December 2007; MillionChart adds the spike bands of the community script by ChrisMoody (2014).
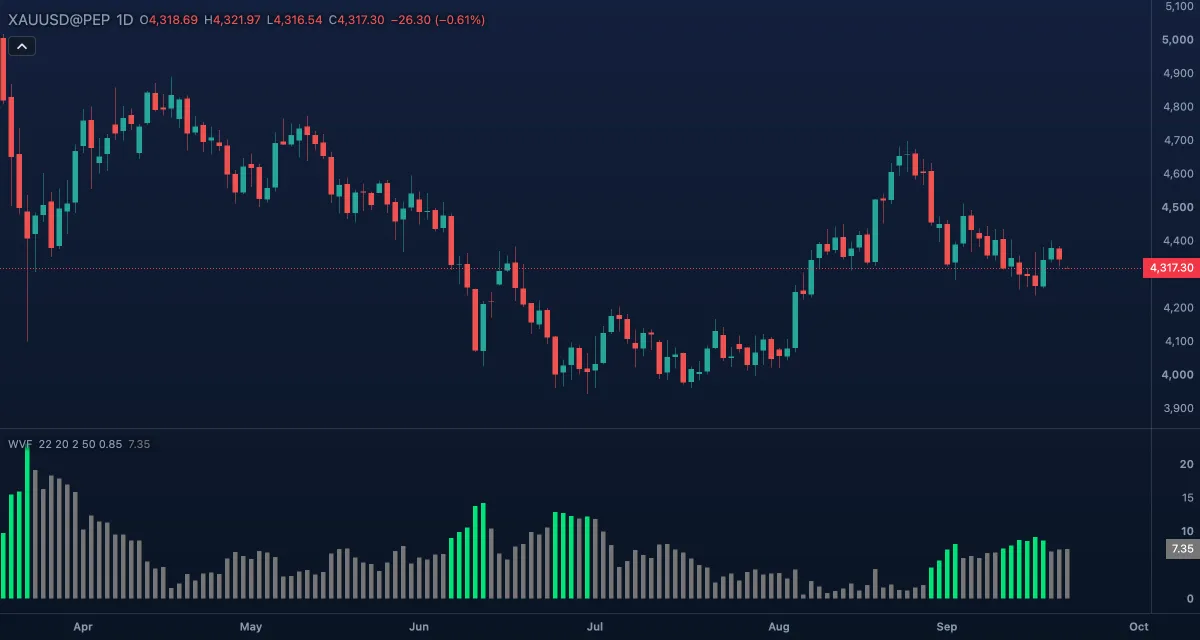
What it shows#
- WVF — a histogram in its own pane, in percent, from zero upward. A tall bar means the low is far below the recent highest close: a sell-off, fear. Grey is normal; green is a spike, a bar at or above the upper band or the range high.
- Upper band — a line: the 20-bar average of WVF plus two standard deviations. Hidden by default; switch it on under Lines in the Inspector.
- Range high — a line: 85% of the highest WVF of the last 50 bars. Also hidden by default.
- Nothing is drawn for greed: the value is near zero whenever the price is at its highs.
How it is calculated#
WVF = 100 × (highest close of the last Lookback bars − this bar's low) ÷ that highest close. The upper band is a Bollinger-style band on WVF itself: its average over Band length bars plus Band multiplier standard deviations. The range high is the highest WVF of the last Percentile lookback bars multiplied by Range high percentile. A bar whose WVF is at or above either line is coloured as a spike.
How traders use it#
- Williams' reading: a spike marks a moment of fear, and fear often peaks near a short-term low. A green bar is a place to look for a long, not a buy by itself.
- The usual entry comes after the spike: the first bar on which WVF drops back under the lines, or a close above the previous bar's high, with the stop under the spike's low.
- In a downtrend the spikes come in a series, one per leg down; a trend filter such as the price above a long moving average keeps you from buying every one.
- It reads only fear and has no top-finding side; for an overbought reading use an oscillator such as RSI.
- Watch out for: in a crash the histogram stays green for days and the true low is known only afterwards. Designed on stock indices, which fall faster than they rise, it catches only one side of a market like gold, where sharp rallies are as common as sell-offs.
Settings#
| Setting | Default | What it changes |
|---|---|---|
| Lookback (highest close) | 22 | Bars over which the highest close is found; about one month of daily candles. |
| Band length | 20 | Bars of the average and standard deviation of WVF for the upper band. |
| Band multiplier | 2 | Standard deviations above the average for the upper band. |
| Percentile lookback | 50 | Bars over which the highest WVF is found for the range high. |
| Range high percentile | 0.85 | The share of that highest value that marks the range high (0.85 = 85%). |
| Colours and style | — | The Spike and Normal colours of the histogram, and the colours of the Upper band and Range high lines. |
Example on gold#
For example, gold's highest close of the month is $4,400 and eight sessions of selling take the low to $4,180. WVF reads 5.0 — (4,400 − 4,180) ÷ 4,400 × 100 — against an upper band near 3.5, so the bar is green: a spike. You do not buy the spike. Two bars later WVF drops back under the band and the day closes at $4,235, above the previous high: that is the entry, with the stop under the spike's low at $4,180.
What would invalidate it: a close below $4,180 — the fear was not the end of the leg, and a new spike is likely.
Add it to your chart#
- Click Indicators in the top strip (on the Pro screen, press I).
- Type
vixand click Williams Vix Fix. - Click its chip in the legend to open the Inspector and change the settings; drag the chip to reorder; the dot hides it; × removes it.
Related#
- Relative Strength Index — an oscillator with both an oversold and an overbought side
- Williams %R — Williams' other oscillator, where the close sits in the recent range
- Bollinger Bands — the bands the upper band is modelled on
- Average True Range — to size the stop under a spike
- Alerts — an alert when the value crosses a level
- Adding and tuning indicators