Arnaud Legoux Moving Average (ALMA)
What ALMA is, how its Gaussian window cuts lag without much noise, its settings on MillionChart and a worked example on gold.
The Arnaud Legoux Moving Average (ALMA) is a moving average whose weights follow a bell curve placed near the newest candles, so the line is smooth and still close to price. It is drawn as one line over the candles in price units. Arnaud Legoux and Dimitrios Kouzis-Loukas published it in 2009.
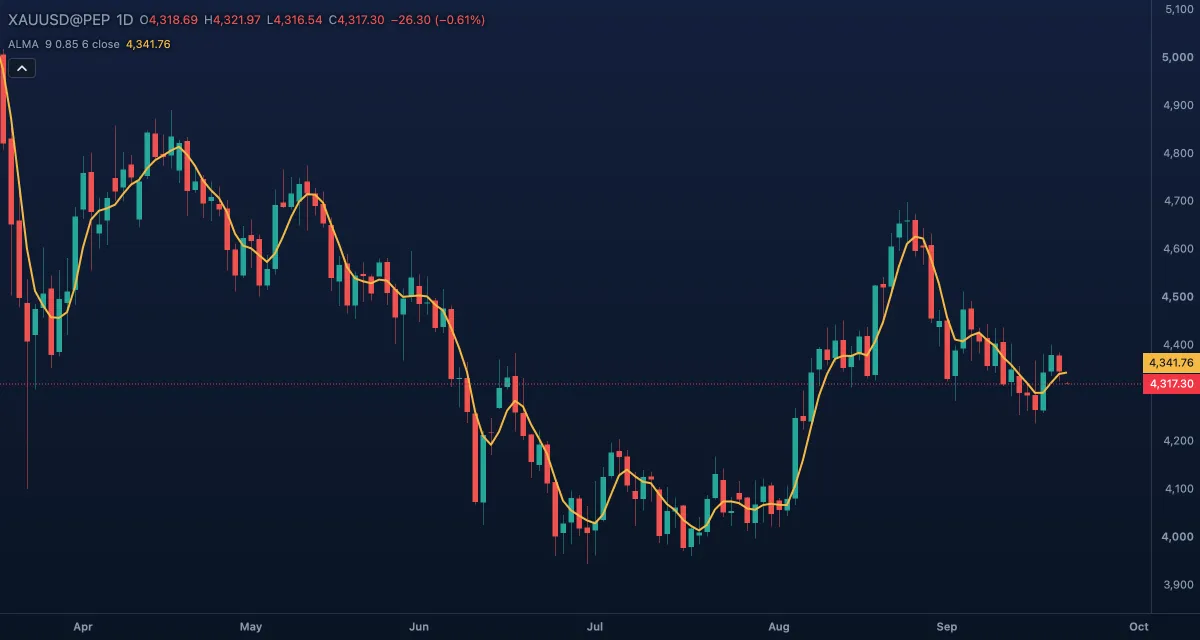
What it shows#
- ALMA — one line over the candles; the legend chip reads
ALMA 9 0.85 6 closewith the current value. - A rising line means the bell-weighted average of the window is going up; price above the line is an upward bias, below it a downward one.
- Next to an EMA of the same length it sits closer to price, because its weight is centred near the newest candles, and the bell keeps it smoother than a plain weighted average.
How it is calculated#
For a window of Length candles the engine builds Gaussian (bell-shaped) weights. Offset, 0 to 1, says where the peak of the bell sits: 0 on the oldest candle, 1 on the newest, 0.85 close to the newest. Sigma sets the width of the bell: larger is a narrower bell that leans on fewer candles, smaller a wider, smoother one. Each candle's Source price is multiplied by its weight and the sum is divided by the sum of the weights.
How traders use it#
- As a smoother trend line: slope and the side of price, like any moving average, with less noise at short lengths.
- Two ALMAs (for example 9 and 21) crossing, read like an EMA cross, with somewhat fewer false crosses in choppy stretches.
- Tune by feel: lower the offset (0.5 to 0.7) for a smoother, later line; raise sigma (8 to 10) for a faster one.
- Watch out for: it is still a lagging average. With the offset near 1 and a large sigma it tracks price so closely that it adds little, and in a range it crosses price as often as any short average.
Settings#
| Setting | Default | What it changes |
|---|---|---|
| Length | 9 | The number of candles in the window, 1 to 5000. |
| Offset | 0.85 | Where the peak of the weights sits, 0 (oldest candle) to 1 (newest). Higher is faster and less smooth. |
| Sigma | 6 | The width of the bell, 0.1 to 100. Larger is a narrower bell: faster, less smooth. |
| Source | Close | The price weighted: Open, High, Low, Close, Mid (HL2), Typical (HLC3) or Average (OHLC4). |
| Colours and style | — | The colour, width and dash of the ALMA line. |
Example on gold#
Picture gold rising from $4,200 to $4,340 on the daily chart over a month, with the ALMA 9 a smooth line under the candles. For example, two sharp down days pull the closes toward the line, but the ALMA stays below the lows and keeps rising, so a trader using it as the trailing stop stays in. The exit comes when a daily close lands below the ALMA and the line turns down, at about $4,300 in this story. If gold is back above the line a candle or two later, the exit was a whipsaw; that happens, and no setting removes it.
Add it to your chart#
- Click Indicators in the top strip.
- Type
almaand click the indicator, or press Enter for the first result. - Click its chip in the legend to open the Inspector and change the settings; drag the chip to reorder; the dot hides it; × removes it.
Related#
- Exponential Moving Average — the usual fast average, for comparison
- Hull Moving Average — another low-lag average, with more overshoot
- Kaufman Adaptive Moving Average — an average that slows itself down in ranges
- Alerts — an alert when the price crosses the line
- Adding and tuning indicators