Volume-Weighted Moving Average (VWMA)
What VWMA is, how volume weights each bar, its settings on MillionChart and a worked example on gold.
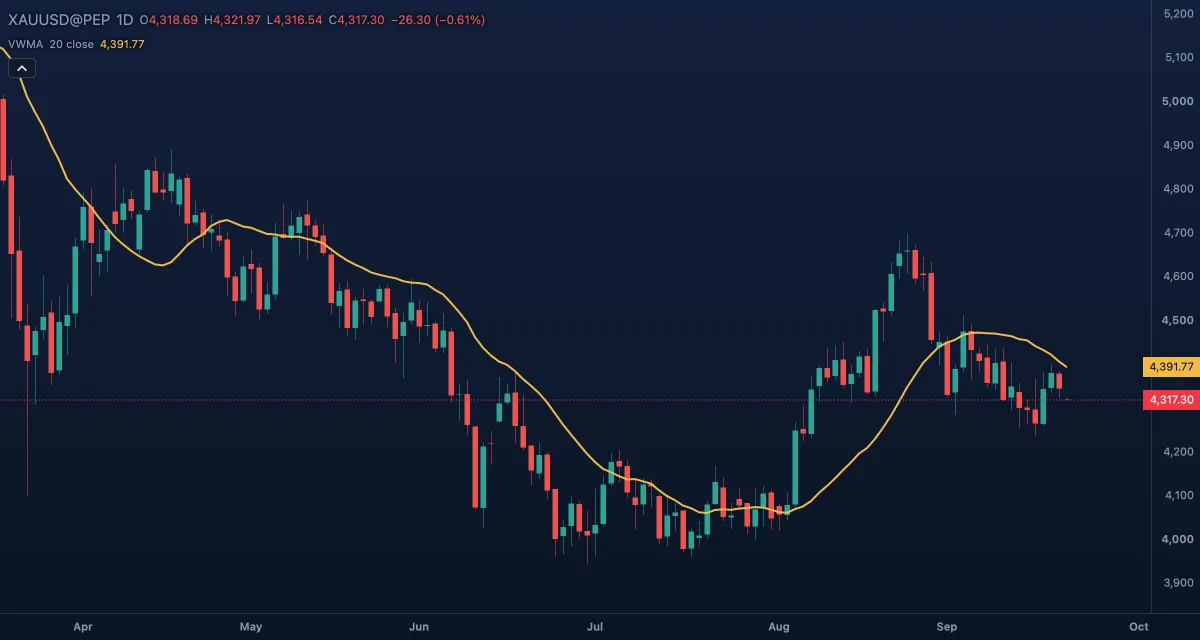
The Volume-Weighted Moving Average is a moving average in which each bar counts in proportion to its volume: a bar that traded twice as much pulls the line twice as hard. Over the last 20 bars it answers "what was the average price paid?", not just "what was the average price?". It is drawn over the candles in price units.
What it shows#
- VWMA — one line over the candles. It sits above a simple average of the same length when the busier bars were the higher ones, and below it when the busier bars were the lower ones.
- Where the feed has no volume, or the window's volume adds up to zero, nothing is drawn. The line needs 20 consecutive bars with both a price and a volume before its first value.
How it is calculated#
Over the last Length bars: VWMA = Σ (price × volume) / Σ volume, where price is the Source of each bar. A simple moving average is the same sum with every volume set to 1, which is why the two are compared.
How traders use it#
- Together with an SMA of the same length: VWMA above the SMA means the volume came in on the up bars (buying with conviction); VWMA below it means the volume came in on the down bars.
- As a trend filter that is harder to fool: a rally on thin volume barely moves the VWMA, so price running far above it on low volume is suspect.
- As moving support in an uptrend: pullbacks to the VWMA are where the recent heavy buyers bought, and they often defend it.
- Crossovers of a short VWMA over a long one, like any moving-average pair, with volume already built in.
- Watch out: it is only as good as the volume. On a symbol whose feed sends no volume the line is empty, and a few huge bars dominate the window until they drop out of it 20 bars later.
Settings#
| Setting | Default | What it changes |
|---|---|---|
| Length | 20 | How many bars are averaged (1 to 5,000). |
| Source | Close | The price that is weighted: Open, High, Low, Close, Mid (HL2), Typical (HLC3) or Average (OHLC4). |
| Colours and style | — | The VWMA line colour. |
Example on gold#
Gold rallies from about $4,200 to $4,300 in two weeks, and the daily VWMA (20) rises to about $4,250, a little above a 20-day SMA on the same chart. For example, a trader reads that as volume favouring the rally, and looks to buy a pullback to the VWMA rather than chase the high.
What would invalidate it: the VWMA slipping below the SMA while price is still near the high. Then the heavy bars were the red ones, the average buyer is under water, and the pullback is more likely to go through the line than to bounce from it.
Add it to your chart#
- Click Indicators in the top strip (on the Pro screen, I does the same).
- Type
vwmaand click the indicator. - Click its chip in the legend to open the Inspector and change the settings; drag the chip to reorder; the dot hides it; × removes it.
Related#
- Simple Moving Average — the same average without the volume weights; put both on the chart
- VWAP — the volume-weighted average price since the start of the session, not over a rolling window
- Volume — the columns the VWMA weights by
- Alerts — an alert when the price crosses the line
- Adding and tuning indicators