QQE
What QQE (Quantitative Qualitative Estimation) draws, how to read its smoothed RSI and trailing level, its settings on MillionChart and an example on gold.
QQE, short for Quantitative Qualitative Estimation, is a smoothed RSI with a trailing level that follows it like a stop: the level ratchets behind the RSI line and flips to the other side when the line crosses it. It is drawn in its own pane on a 0 to 100 scale with a line at 50. It comes from Roman Ignatov's MetaTrader indicator; MillionChart follows the widely used community version.
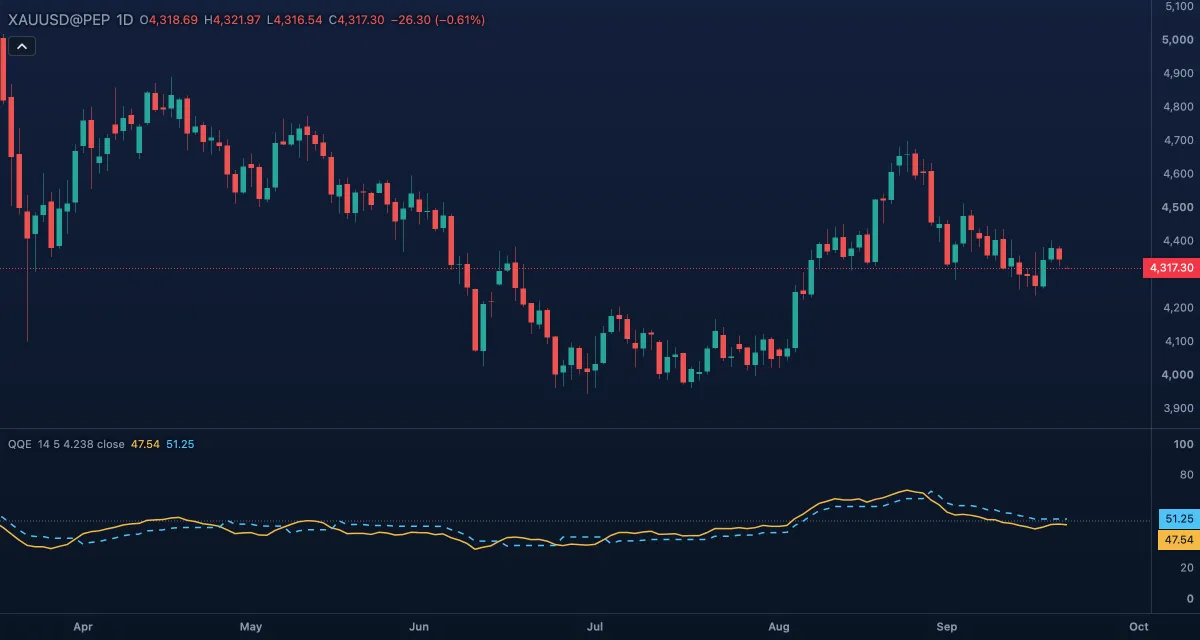
What it shows#
- RSI MA — the main line, a 5-bar exponential average of a 14-bar RSI, in its own pane. Above 50 the smoothed strength is bullish, below 50 bearish.
- Trailing level — a dashed line under the RSI MA while the trend is up and over it while the trend is down. It moves only in the trend's direction until the RSI MA crosses it, then jumps to the other side.
- 50 — a dotted middle level.
How it is calculated#
The engine computes an RSI of the Source over the RSI length (14) and smooths it with an exponential moving average over the RSI smoothing (5): the RSI MA. The bar-to-bar change of that line is averaged twice over Wilder's period (2 × 14 − 1 = 27 bars) and multiplied by the Fast QQE factor (4.238), which gives a band width that follows the RSI's own volatility. The trailing level is the RSI MA minus that width, ratcheting up while the line stays above it, or the RSI MA plus the width, ratcheting down while the line stays below; a cross of the line through the active band switches to the other one.
How traders use it#
- RSI MA above its trailing level and above 50 is read as a bullish state, below both as bearish; many traders trade only in the direction of that state.
- The RSI MA crossing up through the trailing level is the buy trigger of the method, crossing down through it the sell trigger; these crossings are fewer than the RSI's own crosses of 50.
- The 50 line is the filter: a cross of the trailing level on the wrong side of 50 is usually treated as a warning only.
- Watch out for: a strong trend keeps the line pinned high or low, and a sideways stretch near 50 can cross the level several times in a row.
Settings#
| Setting | Default | What it changes |
|---|---|---|
| RSI length | 14 | Bars of the RSI underneath |
| RSI smoothing | 5 | Bars of the exponential average that makes the RSI MA line; higher is smoother |
| Fast QQE factor | 4.238 | Multiplier of the RSI's volatility that sets the trailing level's distance (0.1 to 50); smaller is tighter |
| Source | Close | The price the RSI is computed on: Close, Open, High, Low, Mid, Typical or Average |
| Colours and style | — | The colours of the RSI MA line, the Trailing level and the Middle level |
Example on gold#
Picture gold grinding up from $4,200 to $4,300 over three weeks. The RSI MA has held above 60 and the trailing level has ratcheted up beneath it to about 55. A sharp two-day drop to $4,250 pulls the RSI MA down through the level, which flips above the line. For example, a trader following the method would read that as the end of the long state and close or wait: a cross back above the new level with the RSI MA still above 50 would say the dip was a shake-out, while the RSI MA falling below 50 would confirm the bearish state.
Add it to your chart#
- Click Indicators in the top strip (on the Pro screen you can press I).
- Type
qqeand click the indicator. - Click its chip in the legend to open the Inspector and change the settings; drag the chip to reorder; the dot hides it; × removes it.
Related#
- Relative Strength Index — the line QQE smooths and trails
- SuperTrend — the same ratcheting stop idea applied to price
- Stochastic RSI — another indicator built on top of the RSI
- Alerts — an alert when the value crosses a level
- Adding and tuning indicators