Relative Strength Index (RSI)
What RSI measures, how to read its 70 and 30 levels, its settings on MillionChart and a worked example on gold.
The Relative Strength Index compares the size of recent up moves with the size of recent down moves and turns the result into a number between 0 and 100. A high reading means the last bars rose more than they fell; a low reading means the opposite. J. Welles Wilder published it in 1978.
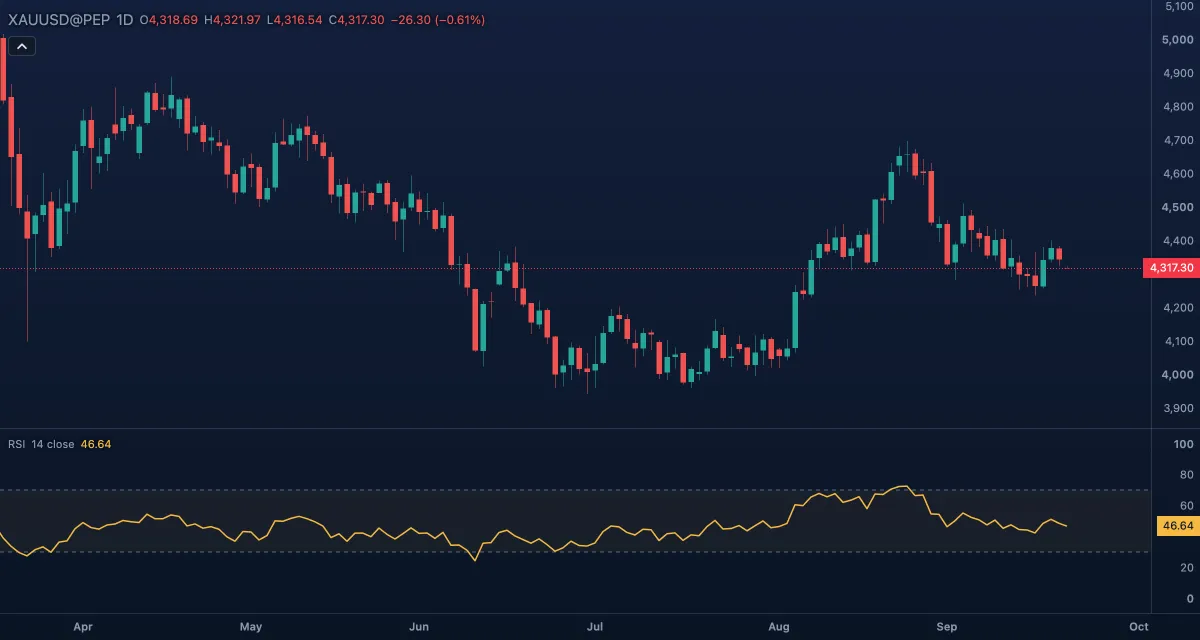
What it shows#
- RSI — one line in its own pane, on a fixed scale from 0 to 100. Rising means the up moves are gaining weight over the down moves; falling, the reverse.
- Overbought — a dashed level at 70.
- Oversold — a dashed level at 30.
- Zone fill — a faint tint between the two levels. There is no 50 line; read the middle from the scale.
How it is calculated#
For each bar the chart takes the change of the Source from the bar before and splits it into an up move and a down move (one of the two is zero). Both are smoothed over Length bars with Wilder's moving average, which weighs the past more than a simple average does. Then RSI = 100 − 100 / (1 + average up move / average down move): 100 when there were no down moves at all, 0 when there were no up moves.
How traders use it#
- Above 70 the symbol is called overbought, below 30 oversold. On its own that is not a sell or buy signal: in a strong trend RSI can sit above 70 for weeks while the price keeps rising.
- The return from the zone is read more often than the entry: RSI falling back under 70 after a stay above it, or rising back over 30.
- The 50 level separates bullish from bearish momentum. In an uptrend RSI tends to hold the 40 to 80 range; in a downtrend 20 to 60.
- Divergence: the price makes a higher high while RSI makes a lower high (or the mirror at a low) says the move is losing strength. It often comes early, so wait for the price to confirm.
- Watch out for whipsaws: a short length such as 7 reacts fast but crosses the levels constantly, and RSI knows nothing about volume or the range of the bars.
Settings#
| Setting | Default | What it changes |
|---|---|---|
| Length | 14 | Bars in the smoothing. Shorter is faster and reaches the levels more often; longer is calmer. |
| Source | Close | Which price is measured: Open, High, Low, Close, Mid (HL2), Typical (HLC3) or Average (OHLC4). |
| Colours and style | — | The colours of the RSI line, the Overbought level, the Oversold level and the Zone fill; width and dash under Look in the Inspector. |
Example on gold#
Gold has climbed, for example, from $4,100 to $4,350 over three weeks on the daily chart and RSI (14) reads 74. That alone is not a reason to sell; it says the rise has been fast. A trader who wants to buy the trend waits for RSI to drop back towards 50 while the price holds above $4,250 — a pullback inside a healthy uptrend. A trader looking for the top waits for a bearish divergence — a new high near $4,380 while RSI only reaches 68 — and then for a daily close under the last swing low.
What would invalidate it: the price keeps closing higher and RSI stays above 70. That is strength, not a reversal.
Add it to your chart#
- Click Indicators in the top strip (on the Pro screen, press I).
- Type
rsiand click the indicator, or press Enter for the first result. - Click its chip in the legend to open the Inspector and change the settings; drag the chip to reorder; the dot hides it; × removes it.
Related#
- Stochastic — a faster bounded oscillator built from the bar's range
- Stochastic RSI — the stochastic applied to RSI, more sensitive
- MACD — an unbounded momentum line to pair with RSI's levels
- Alerts — an alert when RSI crosses 70 or 30
- Adding and tuning indicators