McGinley Dynamic (MD)
What the McGinley Dynamic is, how it adjusts its own speed, its settings on MillionChart and a worked example on gold.
The McGinley Dynamic is a moving average that changes its own speed with the market: it follows price closely when price moves fast and smooths it when price drifts, so it tracks a trend with less lag and fewer false crossings than a fixed average of the same length. It was devised by John R. McGinley and published in the Market Technicians Association Journal. It is drawn over the candles in price units.
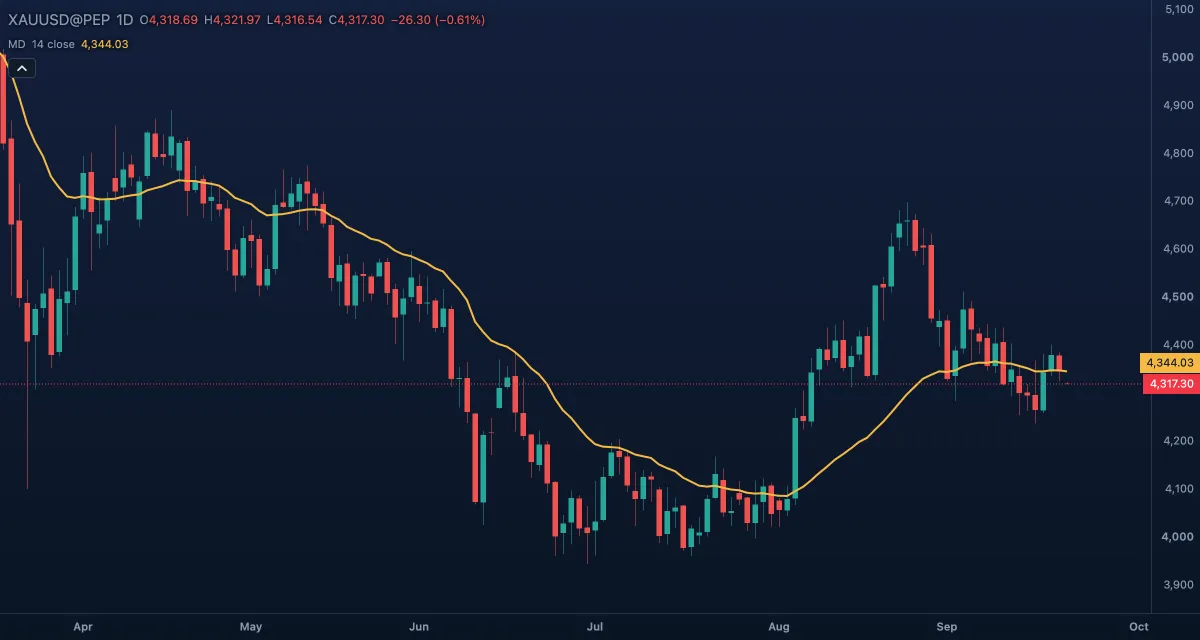
What it shows#
- McGinley Dynamic — one line over the candles. Rising means the smoothed price is going up; price above the line is strength, price below it is weakness.
- The line hugs falling prices more tightly than rising ones (see the calculation), so in a sell-off it stays close and in a rally it gives price more room.
How it is calculated#
Each bar, the line moves part of the way from its previous value towards the Source price: MD = MDprev + (price − MDprev) / (N × (price / MDprev)4), where N is the Length. Near the line the step is simply one N-th of the distance, like Wilder's smoothing. The fourth power of the ratio is the "dynamic" part: when price runs above the line the divisor grows and the step shrinks; when price falls below it the divisor shrinks and the line catches up faster. The first value is the simple average of the first N bars.
How traders use it#
- As a trend line: price holding above a rising MD is an uptrend; price below a falling MD is a downtrend.
- As moving support and resistance: pullbacks that stop at the line keep the trend intact; a close through it is the first warning.
- As the slow or the fast half of a crossover, in place of an EMA: fewer whipsaws in choppy stretches, because the line slows down when price drifts.
- Watch out: it still lags at sharp turns, and its speed is not symmetric. It follows a fall faster than a rise, so a rising line sits further below price than a falling line sits above it.
Settings#
| Setting | Default | What it changes |
|---|---|---|
| Length | 14 | N in the formula (1 to 5,000): the nominal smoothing. Larger is smoother and slower. |
| Source | Close | The price it follows: Open, High, Low, Close, Mid (HL2), Typical (HLC3) or Average (OHLC4). |
| Colours and style | — | The McGinley Dynamic line colour. |
Example on gold#
Gold trends up through the autumn, from about $4,100 to $4,300, and the daily MD (14) runs under the candles the whole way. For example, a trader who wants to stay with the move while it lasts holds while daily closes stay above the line, and treats a dip that stops at the line near $4,250 as a place to add, not to leave.
What would invalidate it: a daily close below the line followed by the line turning down. Because the MD catches up quickly on the way down, a turn in the line soon after such a close says the pullback is more than a pause.
Add it to your chart#
- Click Indicators in the top strip (on the Pro screen, I does the same).
- Type
mcginleyand click the indicator. - Click its chip in the legend to open the Inspector and change the settings; drag the chip to reorder; the dot hides it; × removes it.
Related#
- Exponential Moving Average — the fixed-speed average it is usually compared with
- Kaufman Adaptive Moving Average — another average that changes speed, from the noise of the market instead of the price ratio
- Smoothed Moving Average — Wilder's smoothing, the step the MD takes when price is near the line
- Alerts — an alert when the price crosses the line
- Adding and tuning indicators