Price Volume Trend (PVT)
What Price Volume Trend measures, how it differs from OBV, how to read it, its settings on MillionChart and a worked example on gold.
Price Volume Trend (PVT) is a running total in which each bar adds its volume multiplied by the bar's percent price change. It is a close cousin of On-Balance Volume: OBV adds or subtracts the whole volume whatever the size of the move, PVT scales it by how far the close moved. The line has no fixed range and its level depends on where your loaded history starts; read its direction and shape. No single author is credited with it.
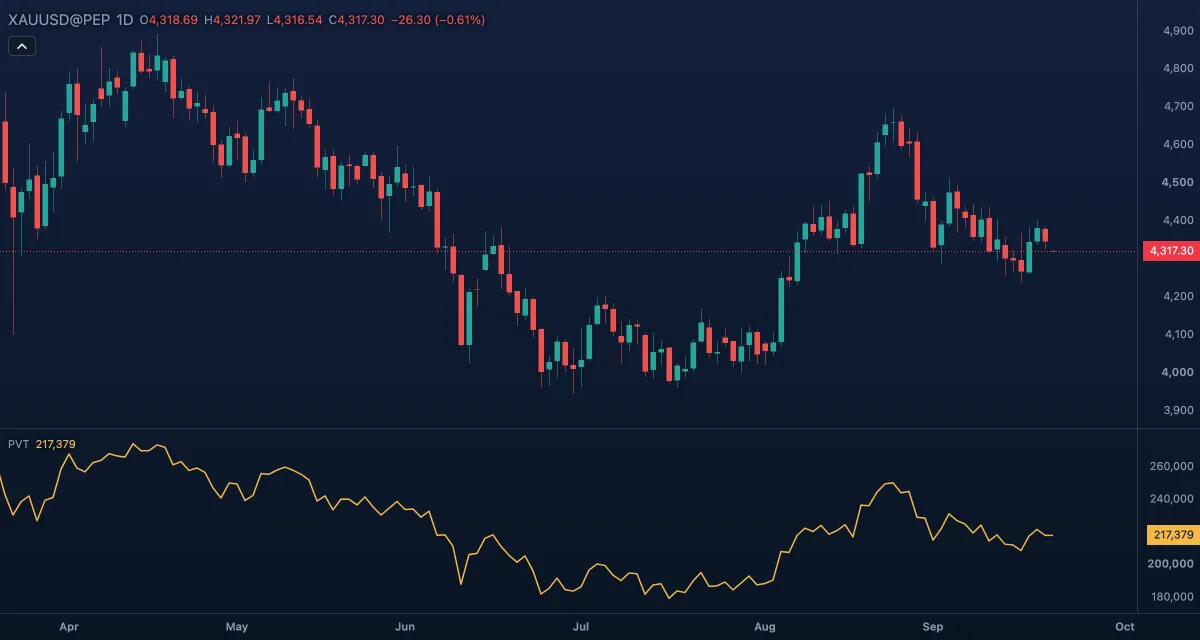
What it shows#
- PVT — one line in its own pane under the chart, in volume units. It rises while the bars with up-closes carry more volume-weighted movement than the bars with down-closes, and falls when the opposite is true. A big move on big volume moves the line a lot; a small move on big volume barely moves it.
There is no average line and no level: PVT draws one line, nothing else.
How it is calculated#
The line starts at 0 on the first bar that has a close and a volume. Each later bar adds volume × (close − previous close) / previous close, so a 1% rise on 10,000 ticks of volume adds 100 and a 1% fall subtracts 100. A bar with a missing close, previous close or volume adds nothing and the line carries its value. On gold and other CFD or forex symbols the volume is the broker's tick volume (the number of price changes in the bar), not contracts traded.
How traders use it#
- Confirmation of a trend: PVT making higher highs with price says the up-bars have had both volume and range behind them.
- Divergence: price at a new high with PVT below its previous high is a bearish divergence; the mirror image at lows is bullish. Because PVT weighs the size of the move, a marginal new high on heavy volume shows up as a smaller PVT rise than a strong one.
- Some traders draw trend lines on PVT itself and read a break of that line as an early warning, before the same line on price gives way.
- Watch out for the missing average: PVT has no built-in signal line on MillionChart, so you judge its slope by eye or draw a line on it. Like every running total it can keep a divergence alive for a long time, and one huge bar shifts the whole line.
Settings#
PVT has no calculation settings.
| Setting | Default | What it changes |
|---|---|---|
| Colours and style | — | The colour of the PVT line. |
Example on gold#
For example, gold rallies on daily candles from about $4,150 to $4,300 and the biggest daily gains come on the busiest days; PVT rises steeply and tops with price. Three weeks later price edges to $4,310, but the gain came in small daily steps on ordinary volume, and PVT sits well below its earlier peak. A trader looking to buy a breakout above $4,300 waits instead, and asks for a close above $4,320 with PVT rising through its earlier high before trusting the move. A fast PVT rise to a new high would show that the volume and the range had returned.
Add it to your chart#
- Click Indicators in the top strip (on the Pro screen the key is I).
- Type
pvtand click the indicator. - Click its chip in the legend to open the Inspector and change the settings; drag the chip to reorder; the dot hides it; × removes it.
Related#
- On-Balance Volume — the same running total without the size of the move
- Accumulation/Distribution Line — a running total weighed by where the close sits in the bar's range
- Net Volume — each bar's signed volume on its own
- Alerts — an alert when PVT crosses a level you set
- Adding and tuning indicators