Typical Price
What the typical price line is, how it is calculated from each bar's high, low and close, its setting on MillionChart and an example on gold.
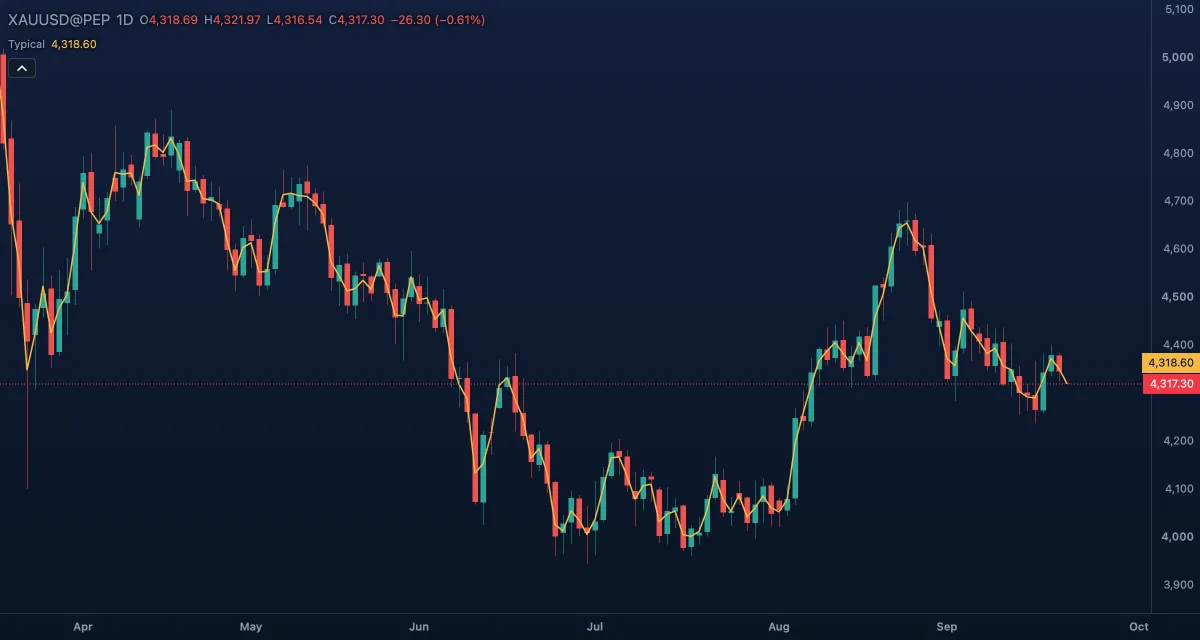
Typical Price draws one line over the candles: the average of each bar's high, low and close. It is the price a bar is "typically" credited with — the close weighted by where the range was — and the hlc3 source behind CCI, Money Flow Index, VWAP and the pivot point itself.
What it shows#
- Typical — a thin gold line through each candle, between its midpoint and its close.
- It follows the close more than the median does but still smooths it with the range: a bar that spiked and closed in the middle shows a typical price in the middle.
How it is calculated#
Typical price = (high + low + close) / 3, for every bar. There is no length and no smoothing; a bar missing one of the three gets no value.
How traders use it#
- As a source: choose Typical as the source in the Inspector of a moving average or an oscillator for a reading that is less sensitive to the exact closing tick than the close itself.
- Where it already is: CCI, MFI and VWAP are built on the typical price, and the Traditional pivot of Pivot Points is the previous period's typical price. Drawing it shows what those indicators actually average.
- Compared with the close: a close above the typical price means the bar closed in its upper part; a line of closes crossing the typical line is a small, early momentum change.
- Watch out for its limits: it is still a one-bar figure with no memory. For a trend, average it; for the range, look at the candle.
Settings#
| Setting | Default | What it changes |
|---|---|---|
| Colours and style | — | Typical price: the line's colour, width and type under Lines in the Inspector. There are no calculation inputs. |
Example on gold#
For example, a daily gold bar trades from $4,276 to $4,312 and closes at $4,306: its median is $4,294 but its typical price is $4,298, pulled towards the strong close. The next day ranges from $4,290 to $4,320 and closes at $4,296, near its low; the typical price is $4,302, slightly higher while the close fell $10. A trader who measures momentum on the typical price sees a market still inching up; one who watches closes sees a rejection. Neither is wrong — the typical price simply counts the whole range — and a VWAP or a 20-period EMA on Typical will turn only when the ranges themselves start falling.
Add it to your chart#
- Click Indicators in the top strip (on the Pro screen, press I).
- Type
typicaland click the indicator. - Click its chip in the legend to open the Inspector and change the settings; drag the chip to reorder; the dot hides it; × removes it.
Related#
- Median Price — the midpoint of the bar, without the close
- VWAP and CCI — indicators built on the typical price
- Pivot Points — the pivot is the previous period's typical price
- Alerts — an alert when the price crosses the line
- Adding and tuning indicators