Negative Volume Index (NVI)
What the Negative Volume Index measures, how to read it against its signal line, its settings on MillionChart and a worked example on gold.
The Negative Volume Index (NVI) is a running index that changes only on the bars whose volume fell below the previous bar's — the quiet bars, where the crowd is absent and the better-informed money is thought to act. It starts at 1,000 and has no fixed range; its level depends on where your loaded history begins, so read its direction and its position against the signal line, not the number. Paul Dysart devised it in the 1930s; Norman Fosback brought it to prices in Stock Market Logic (1976).
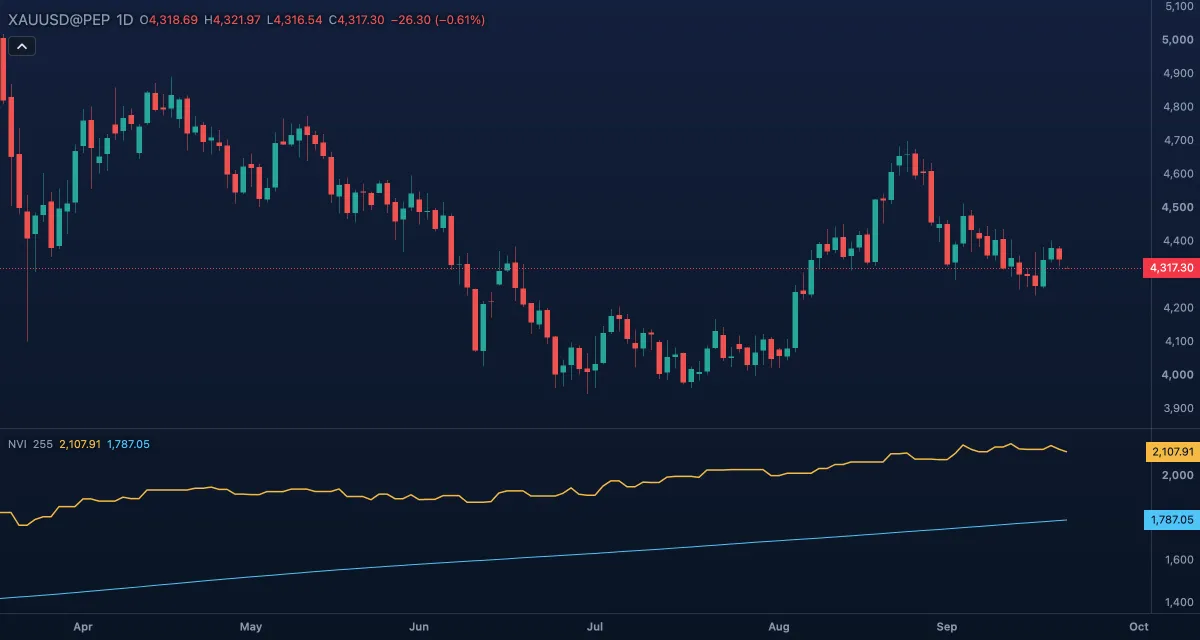
What it shows#
- NVI — a line in its own pane under the chart. It rises when a bar closed higher than the bar before it on lower volume, falls when such a bar closed lower, and stays flat on every bar whose volume rose or stayed the same.
- Signal — an exponential moving average (EMA) of the index, 255 bars by default, about one trading year of daily candles. The index above its signal is the bullish reading, below it the bearish one.
How it is calculated#
The index starts at 1,000 on the first bar that has a close and a volume. On each later bar whose volume is lower than the previous bar's, the index changes by the same percentage as the close did; on every other bar it keeps its value. The signal is an EMA of the index over Signal length (EMA). On gold and other CFD or forex symbols the volume is the broker's tick volume (the number of price changes in the bar), not contracts traded.
How traders use it#
- Fosback's reading: NVI above its one-year average favours a rising market, below it a falling one. It is a slow background read, not an entry trigger.
- A cross of the index above the signal after a long stretch below it is read as a change of regime; the opposite cross as the end of one.
- Pair it with the Positive Volume Index: both rising confirms a trend; NVI rising while PVI falls shows quiet accumulation against a noisy crowd.
- Watch out for its silence: NVI moves on only part of the bars, so flat stretches are normal and it can stay on one side of the signal for months. The signal needs 255 bars before it appears, so on a short history you see the index alone.
Settings#
| Setting | Default | What it changes |
|---|---|---|
| Signal line | On | Draws the EMA of the index. Off leaves the index on its own. |
| Signal length (EMA) | 255 | The bars of the signal's EMA. 255 is about one year of daily candles; a shorter length reacts sooner and crosses more often. |
| Colours and style | — | The colour of the NVI line and of the Signal line. |
Example on gold#
For example, gold has drifted from about $4,400 to $4,300 on daily candles over six weeks, and the bars that made the losses carried heavy volume. NVI, which ignores those bars, has barely moved and still sits above its signal line while price makes lower lows. A trader takes this as a sign that the quiet bars were being bought, and waits for a close back above a recent swing high, say $4,350, before acting. NVI turning down through its signal line would invalidate the reading: the quiet bars have started to close lower as well.
Add it to your chart#
- Click Indicators in the top strip (on the Pro screen the key is I).
- Type
nviand click the indicator. - Click its chip in the legend to open the Inspector and change the settings; drag the chip to reorder; the dot hides it; × removes it.
Related#
- Positive Volume Index — the twin that follows the busy bars instead
- On-Balance Volume — the simpler running total of signed volume
- Volume — the columns the index is built from
- Alerts — an alert when the index crosses its signal line
- Adding and tuning indicators