Chaikin Money Flow (CMF)
What Chaikin Money Flow measures, its range from −1 to +1, how to read the zero line, its settings on MillionChart and an example on gold.
Chaikin Money Flow measures buying and selling pressure over a window of candles: the volume of the last 20 candles, weighted by where each candle closed in its range, divided by the total volume of those candles. It runs from −1 to +1. Above zero the window's closes have leaned toward the highs (money flowing in); below zero, toward the lows. Marc Chaikin devised it as the windowed form of his A/D line.
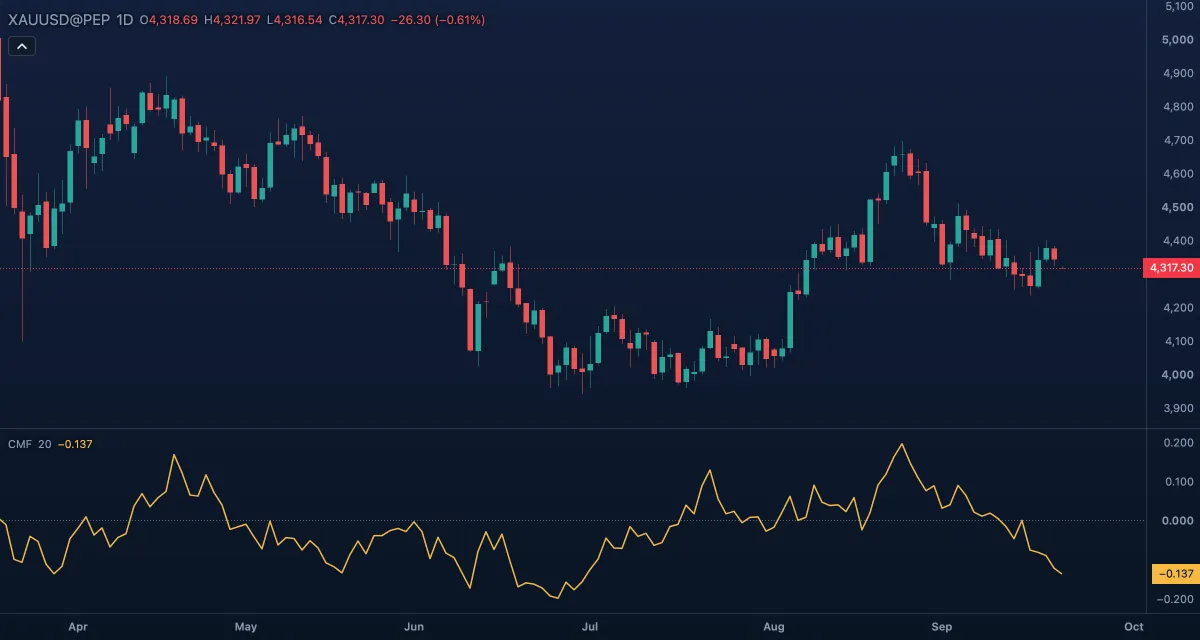
What it shows#
- CMF — a gold line in its own pane, between −1 and +1. Positive and rising: buying pressure building; negative and falling: selling pressure. In practice it rarely leaves the band between −0.5 and +0.5.
- Zero — a dotted line. Which side CMF sits on, and for how long, is the main reading.
- Three decimals are shown, because typical readings are small, around 0.1 to 0.3.
How it is calculated#
For each candle, the money flow multiplier = ((close − low) − (high − close)) / (high − low): +1 for a close at the high, −1 at the low, 0 when the high equals the low. The money flow volume is that multiplier times the volume. CMF = Σ(money flow volume over Length candles) / Σ(volume over the same candles). It needs Length complete candles before its first value and has no value where the window's volume is zero.
How traders use it#
- Sign: CMF above zero for a sustained stretch (several weeks on daily candles) supports an uptrend; below zero, a downtrend. A brief flicker across zero is noise.
- Strength: readings above about +0.25, or below −0.25, are taken as strong pressure. They confirm a trend; they are not overbought or oversold readings.
- Divergence: price at a new high with CMF lower than at the previous high says the closes behind the new high were weaker.
- Breakout check: a breakout from a range with CMF turning clearly positive is more trustworthy than one with CMF near zero.
- Watch out for: a gap counts only by the candle's own range, so gaps are not seen; the window drops old candles abruptly, so CMF can jump when a big candle leaves it; on gold and forex it is tick volume.
Settings#
| Setting | Default | What it changes |
|---|---|---|
| Length | 20 | Candles in the window — the usual textbook length; 21 is also common. Longer is smoother and slower. |
| Colours and style | — | CMF (the line) and Zero line; width and visibility under Lines in the Inspector. |
Example on gold#
Suppose gold on daily candles has traded sideways between $4,260 and $4,320 for a month while CMF has crept from −0.05 to +0.18: the closes inside the range are drifting toward the highs. For example, a trader reads this as accumulation and prepares to buy a daily close above $4,320, with a stop under $4,255.
What invalidates it: CMF falling back below zero before the break; or a breakout candle on which CMF barely moves — the break then lacks the pressure behind it, and the trader waits for a retest instead.
Add it to your chart#
- Click Indicators in the top strip (on the Pro screen, press I).
- Type
cmfand click Chaikin Money Flow, or press Enter for the first result. - Click its chip in the legend to open the Inspector and change the settings; drag the chip to reorder; the dot hides it; × removes it.
Related#
- Accumulation/Distribution Line — the running total this ratio is built from
- Money Flow Index — money flow on a 0–100 scale with overbought and oversold levels
- Chaikin Oscillator — the momentum of the A/D line
- Alerts — an alert when the value crosses zero or a level
- Adding and tuning indicators