Rank Correlation Index (RCI)
What the Rank Correlation Index measures, how to read its +80 and −80 levels, its settings on MillionChart and a worked example on gold.
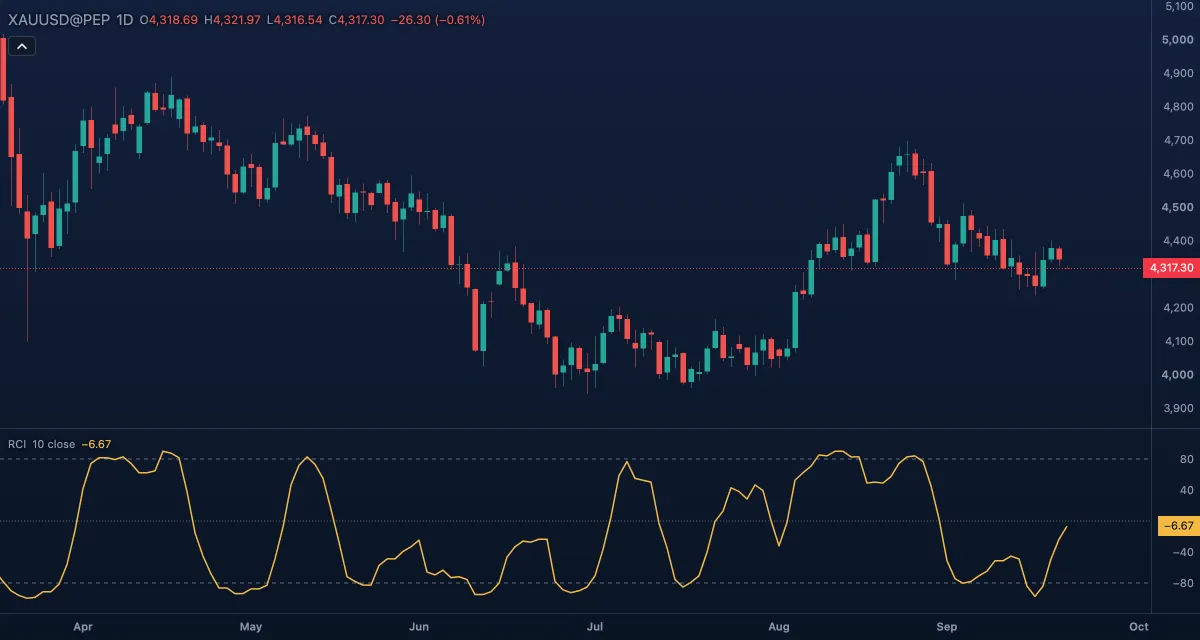
The Rank Correlation Index (RCI) asks one question of the last bars: how steadily has price gone up or down? It ranks the closes of the window by time and by price and measures how well the two orders agree: +100 when every bar closed higher than the one before, −100 when every bar closed lower, near 0 when the closes were mixed. It is drawn in its own pane on a fixed −100 to +100 scale with levels at +80 and −80. The RCI is a staple of Japanese charting; the statistic underneath is Spearman's rank correlation.
What it shows#
- RCI — one line in its own pane. Near +100 the closes of the window rose almost bar by bar, near −100 they fell almost bar by bar, around zero there was no steady direction. It measures the regularity of a move, not its size: ten small up-closes in a row score the same +100 as ten large ones.
- Upper and Lower — dashed levels at +80 and −80.
- Zero — a dotted line at 0.
How it is calculated#
For the last Length bars (10) each close gets a time rank (the newest bar is 1) and a price rank (the highest close is 1; equal closes share the average of their ranks). The RCI is Spearman's rank correlation of the two rankings in percent, 100 × (1 − 6 Σd² / (n (n² − 1))), where d is the difference between a bar's two ranks and n the length. The Source can be another price than the close. The first value appears on the tenth bar.
How traders use it#
- Above +80 is a steady rise over the window — an overbought zone in the Japanese reading — and the line turning down from there is a sell setup; below −80 and turning up is the mirror buy setup.
- A rise through zero says the window has tipped from falling to rising on balance.
- A common layout stacks three RCIs with different lengths (for example 9, 26 and 52): the short one times the entry, the long one gives the direction. Add the indicator three times and change the Length of each.
- Watch out for: with a short length the line swings from one extreme to the other within a few bars, and in a sideways market it crosses the levels constantly.
Settings#
| Setting | Default | What it changes |
|---|---|---|
| Length | 10 | Bars in the window that is ranked (2 to 500); longer is smoother and slower to reach the extremes |
| Source | Close | The price that is ranked: Close, Open, High, Low, Mid, Typical or Average |
| Colours and style | — | The colour of the RCI line and of the Upper level, Zero line and Lower level |
Example on gold#
Suppose gold has risen on eight of the last ten daily candles, from $4,220 to $4,300, and the RCI reads +90. For example, a trader who bought early in the move could use the line turning down and crossing back below +80 as a cue to take part of the profit, since the steady run is breaking. If the RCI holds above +80 while price keeps closing higher, the cue has not come. A fall through zero would say the last ten closes are now mixed to lower.
Add it to your chart#
- Click Indicators in the top strip (on the Pro screen you can press I).
- Type
rciand click the indicator. - Click its chip in the legend to open the Inspector and change the settings; drag the chip to reorder; the dot hides it; × removes it.
Related#
- Relative Strength Index — momentum from the size of the up and down closes rather than their order
- Aroon — another measure of how recently the highs and lows were made
- Momentum — the plain price change over a window
- Alerts — an alert when the value crosses a level
- Adding and tuning indicators