52-Week High and Low
What the 52-week high and low lines mark, how they are built from daily bars, their settings on MillionChart and an example on gold.
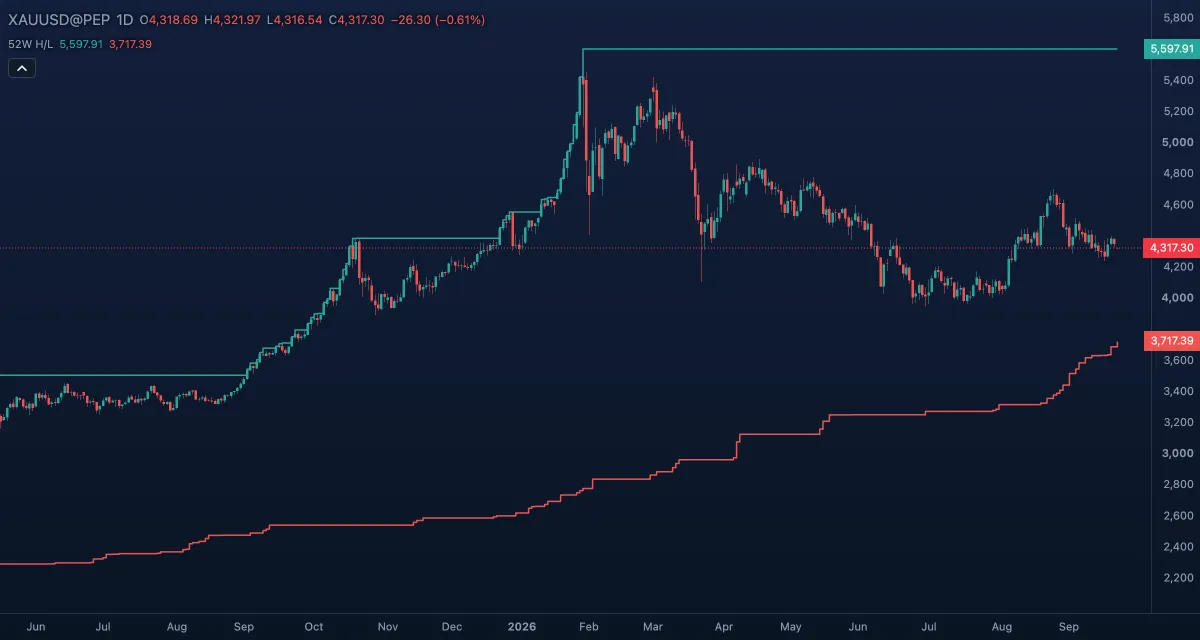
52-Week High and Low draws two step lines over the candles: the highest high and the lowest low of the last 52 weeks of trading. They are the levels the financial press quotes ("gold at a 52-week high") and a simple frame for where the price stands in its year.
What it shows#
- 52-week high — a green step line at the highest high of the window. It steps up the moment a bar trades above it and stays flat otherwise; it steps down only when the old high drops out of the window.
- 52-week low — a red step line at the lowest low of the window, the mirror.
- The distance between the lines is the year's range; where the price sits between them is its position in that range.
- On an intraday chart the lines include the current day's bars so far, so a new yearly high shows the moment it is made, never earlier.
How it is calculated#
The window is 52 weeks (364 days) of trading: the closed daily bars of the 363 days up to the newest closed day, plus the current day with its bars so far. Every chart reads the daily bars for this — the daily chart its own, the other timeframes the daily history behind them — and only the newest closed day a bar could have seen counts, so nothing is drawn with hindsight. The lines start only once a full year of daily history is loaded; before that they are empty, and if the chart has no daily bars at all a small note says so. There are no calculation inputs.
How traders use it#
- A close at a new 52-week high is a sign of strength that momentum and breakout traders buy; a new 52-week low is the mirror. The caveat: the first break often comes back to retest the level before going on.
- The lines are reference levels. Price approaching the high after a long climb is where profit-taking tends to show; a bounce off the 52-week low is a common place for a mean-reversion long.
- Position in the range: a price in the top tenth of its yearly range is in a strong trend; one in the middle is in no trend at all, whatever the shorter timeframes say.
- Use it as a filter rather than a trigger: "longs only while above the midpoint of the year's range" is a simple rule that keeps you on the right side of long trends.
- Watch out for the lag on the way down: the high line falls only when a year has passed since that high, so a market that peaked eleven months ago still shows that peak as its 52-week high.
Settings#
| Setting | Default | What it changes |
|---|---|---|
| Colours and style | — | 52-week high (green) and 52-week low (red): their colour, width and line type under Lines in the Inspector. The window itself is fixed at 52 weeks. |
Example on gold#
For example, gold has risen through the year and its 52-week high line stands at $4,340 while the price is at $4,318, in the top tenth of the yearly range. A trend follower reads this as "stay long, and add on a daily close above $4,340"; the 52-week low line, hundreds of dollars lower, says the trend is old and a deep pullback is possible, so the stop should be a recent swing low, not the low line. A daily close back under $4,250, the last swing low, would end the plan; a close above $4,340 that fails within a few days would suggest a double top rather than a breakout.
Add it to your chart#
- Click Indicators in the top strip (on the Pro screen, press I).
- Type
52and click the indicator. - Click its chip in the legend to open the Inspector and change the settings; drag the chip to reorder; the dot hides it; × removes it.
Related#
- Donchian Channels — the same highest-high / lowest-low idea over any number of bars
- Pivot Points — levels for the day, week, month or year from the previous period
- Alerts — an alert when the price crosses the 52-week high or low
- Adding and tuning indicators