Elder-Ray (Bull and Bear Power)
What Elder-Ray's bull and bear power measure against a 13-bar EMA, how to read them with the trend, its setting on MillionChart and an example on gold.
Elder-Ray measures how far the buyers could push the price above a 13-bar exponential moving average on each bar, and how far the sellers could push it below: bull power is the high minus the EMA, bear power the low minus the EMA. The values are in price units. Alexander Elder published it in Trading for a Living in 1993. Both lines share one pane around zero.
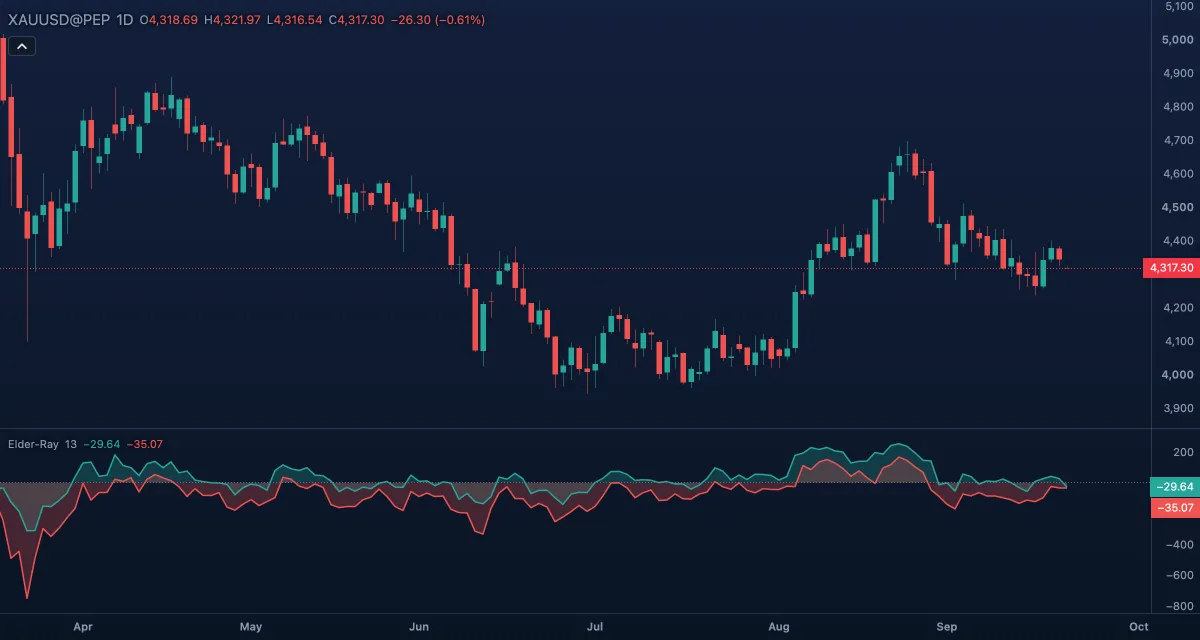
What it shows#
- Bull power (green line with a shaded area to zero): the bar's high minus the EMA. Positive while the high is above the average; the larger, the further the buyers reached.
- Bear power (red line with a shaded area to zero): the bar's low minus the EMA. Negative while the low is below the average; the deeper, the further the sellers reached.
- Zero: a dotted line. It stands for the EMA itself.
Bull power is always above bear power, because the difference between them is the bar's range. In a strong rise bear power turns positive (the whole bar sits above the average); in a strong fall bull power turns negative. The values are printed with the symbol's digits.
How it is calculated#
An EMA of the close over EMA length bars, Elder's 13. Bull power = high − EMA; bear power = low − EMA, for every bar. That is all: one setting, and no source option, because the high and the low are fixed by the definition.
How traders use it#
- With the trend: Elder reads the trend from the slope of the EMA. His buy rule is an EMA that is rising while bear power is below zero but rising, so the sellers are weakening; his sell rule is an EMA that is falling while bull power is above zero but falling.
- Divergence: price makes a lower low while bear power makes a higher low, Elder's strongest buy signal; price makes a higher high while bull power makes a lower high, his strongest sell signal.
- Strength: bear power above zero means every part of the bar is above the average, a strong uptrend; bull power below zero is the mirror image.
- Watch out for: the values are in price units, so they cannot be compared across symbols or timeframes. A 13-bar average is short, so on a 1-minute chart it says little about the day. Elder built it to be used with a trend from a longer timeframe, not alone.
Settings#
| Setting | Default | What it changes |
|---|---|---|
| EMA length | 13 | Bars of the exponential moving average both powers are measured from. Longer makes both lines larger and smoother. |
| Colours and style | — | The colours of bull power, bear power and the zero line. |
Example on gold#
Suppose gold is rising on the daily chart, with the 13-bar EMA sloping up through about $4,250, for example. A pullback takes three sessions below the average: bear power is negative and deepens to about −40, then on the fourth session it is still negative but less so, about −15, while the EMA keeps rising. That is Elder's buy condition: trend up, sellers weakening. A trader might buy on a move above that bar's high with a stop under the pullback low. If bear power instead keeps deepening and the EMA turns down, the condition is gone.
Add it to your chart#
- Click Indicators in the top strip (on the Pro screen, press I).
- Type
elderand click Elder-Ray (Bull and Bear Power). - Click its chip in the legend to open the Inspector and change the settings; drag the chip to reorder; the dot hides it; × removes it.
Related#
- Exponential Moving Average — the average both powers are measured from
- Elder Force Index — Elder's other indicator, price change times volume
- Balance of Power — who won each candle, from open and close
- Alerts — an alert when bear power crosses zero
- Adding and tuning indicators