Relative Volatility Index (RVI)
What the Relative Volatility Index measures, how it confirms trend signals around 50, its two variants, its settings and an example on gold.
The Relative Volatility Index measures the direction of volatility: whether the recent standard deviation of price has been building on bars that closed up or on bars that closed down. It is the RSI formula with the standard deviation in place of the price change, so it runs from 0 to 100. Donald Dorsey published it in 1993 and revised it in 1995. It is not the Relative Vigor Index, which some charts also shorten to RVI.
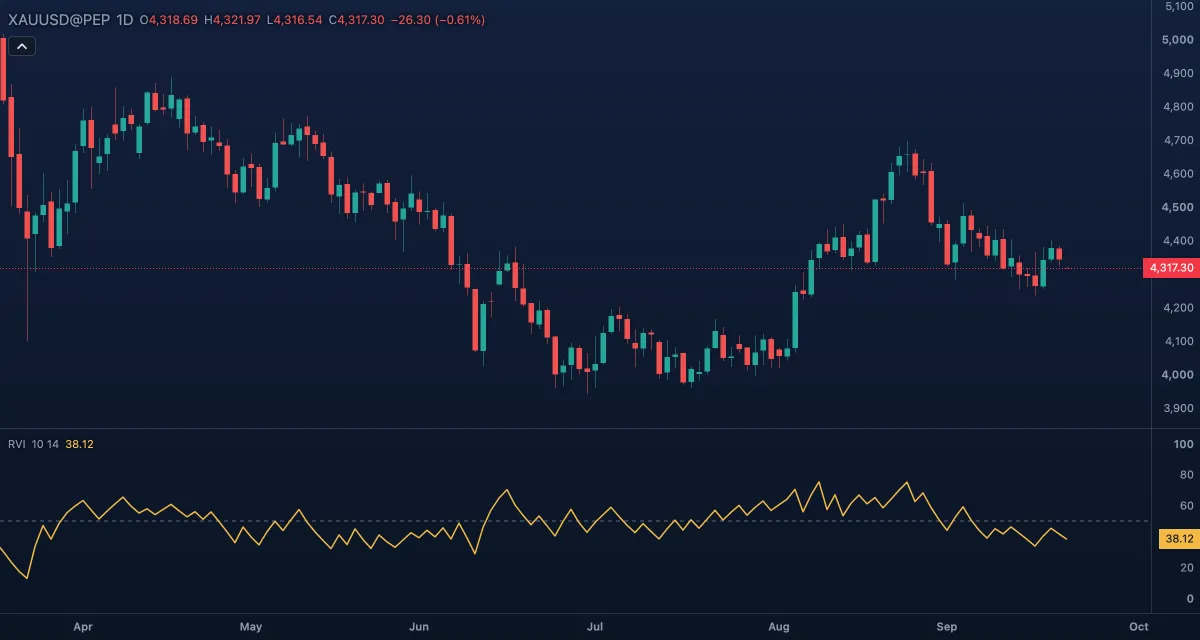
What it shows#
- RVI — a line in its own pane with a fixed 0–100 scale. Above 50, volatility has been concentrated in rising bars; below 50, in falling bars. The further from 50, the more one-sided it has been.
- Middle — a dashed level at 50, the line Dorsey divided buys from sells with.
- Unlike RSI, 70 and 30 are not overbought and oversold levels here: the index measures who holds the volatility, not how stretched the price is.
How it is calculated#
The indicator takes the standard deviation of the close over StdDev length bars. On a bar that closed above the previous close, that deviation counts as "up"; on a bar that closed below, as "down". Each side is averaged over Smoothing bars, and RVI = 100 × up average ÷ (up average + down average). Variant High and low (1995) computes the index once on the highs and once on the lows and averages the two. The second setting called Smoothing chooses the average: EMA is the common chart form, Wilder is Dorsey's original arithmetic, the same averaging RSI uses.
How traders use it#
- Dorsey's rule: use it as a filter for another indicator's signal. Take a buy signal only when RVI is above 50, a sell signal only when it is below 50.
- His further rules, as usually quoted: a signal you skipped can still be taken when RVI goes above 60 (buys) or below 40 (sells); a long is closed when RVI falls under 40, a short when it rises over 60.
- A cross of 50 on its own is not a signal: it says where the volatility has been, not where the price is going.
- Watch out for: in a flat range the index hovers near 50 and flips often, and because it is smoothed twice (a 10-bar deviation, then a 14-bar average) it turns late. The EMA form reacts faster than Wilder but is less smooth.
Settings#
| Setting | Default | What it changes |
|---|---|---|
| StdDev length | 10 | Bars in the standard deviation that feeds the index. |
| Smoothing | 14 | Bars in the averages of the up and down deviations. Longer is smoother and slower. |
| Variant | Close (1993) | Close (1993): the original, on the close. High and low (1995): the average of the index on the highs and on the lows. |
| Smoothing | EMA | The second setting of that name: the kind of average. EMA: the common chart form. Wilder: Dorsey's original, as in RSI. |
| Colours and style | — | The colours of the RVI line and the Middle level. |
Example on gold#
For example, gold closes above its 50-day moving average at $4,310 after a month below it, and that cross is the signal you trade. RVI (10, 14) reads 58: the recent volatility has been on up days, so by Dorsey's rule the buy passes the filter. You go long with the stop under the last swing low at $4,250. Had RVI read 42, the same cross would have been skipped.
What would end it: RVI falling under 40 while the price stalls — Dorsey's exit for a long — or the stop being hit.
Add it to your chart#
- Click Indicators in the top strip (on the Pro screen, press I).
- Type
rviand click Relative Volatility Index. - Click its chip in the legend to open the Inspector and change the settings; drag the chip to reorder; the dot hides it; × removes it.
Related#
- Relative Strength Index — the formula this index is built on, applied to price change
- Average Directional Index — trend strength, another filter for signals
- Standard Deviation — the deviation RVI splits into up and down
- Relative Vigor Index — a different indicator with the same initials
- Alerts — an alert when the value crosses a level
- Adding and tuning indicators