Moving Average Envelopes (Env)
What envelopes draw, how to pick the percentage, their settings on MillionChart and an example on gold.
Moving Average Envelopes draw two lines a fixed percentage above and below a moving average, over the candles. Unlike Bollinger Bands or Keltner Channels, the width does not follow volatility: it follows the price level, and you choose it. The lines are in price units.
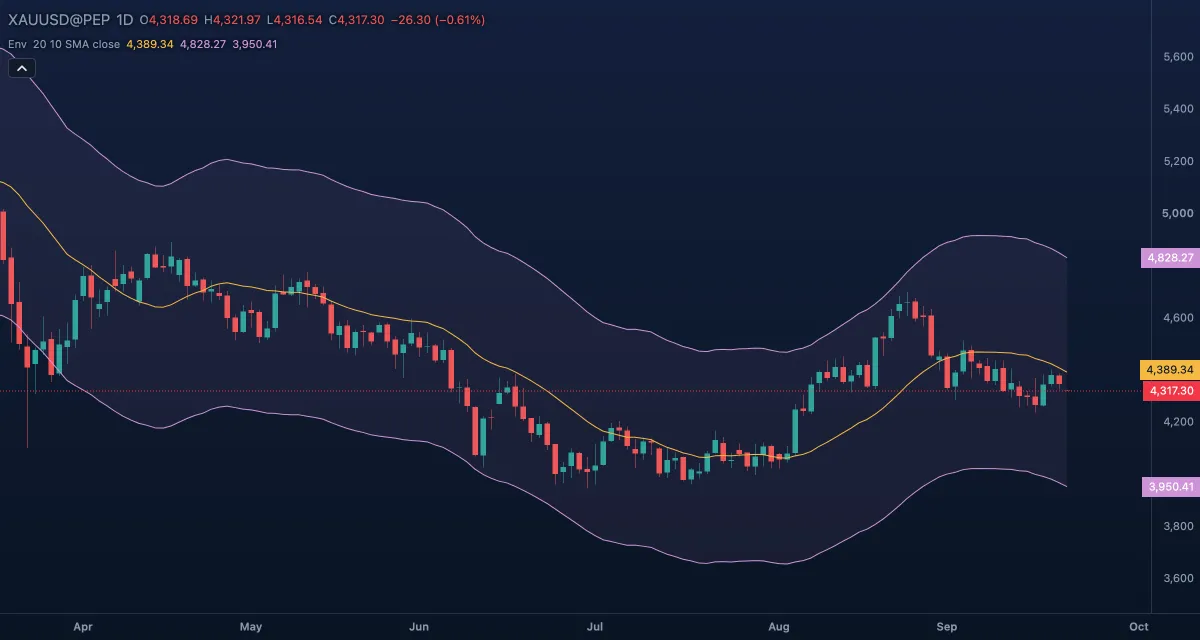
What it shows#
- Basis — the 20-bar simple moving average of the source; its slope is the trend.
- Upper — the basis plus 10 percent of itself. The price above it is far from its average.
- Lower — the basis minus 10 percent of itself.
- Band fill — the tint between the two lines.
How it is calculated#
The basis is the simple or exponential average of the Source over Length bars, as set by Average. The upper line is the basis multiplied by (1 + Percent / 100) and the lower line the basis multiplied by (1 − Percent / 100). The first value appears after Length bars for the simple average; the exponential one needs a longer warm-up.
How traders use it#
- Over-extension: the price outside the envelope is far from its average and often comes back to it, so the lines mark where to look for a swing back, with the basis as the target.
- Trend: to a trend trader the same close outside the envelope is strength. The two readings are separated by the trend on a higher timeframe, not by the envelope.
- Trend filter: trading only in the direction of the basis slope keeps you out of counter-trend trades.
- The percentage is the whole indicator. The default of 10 percent is the common chart setting for daily and longer charts; on gold's daily chart it puts the lines about $430 from the average, which the price seldom reaches. A few percent on daily bars and a fraction of a percent on intraday bars bring them into play; set it by how far past swings went from the average.
- Watch out: a fixed percentage does not know that the market has turned wild or quiet, so an envelope tuned in a calm month is too tight in a volatile one, and the average lags like any other.
Settings#
| Setting | Default | What it changes |
|---|---|---|
| Length | 20 | How many bars the basis averages. |
| Percent | 10 | How far the lines sit from the basis, as a percentage of it (0.1 to 50). |
| Average | SMA | The kind of average: SMA (simple) or EMA (exponential, which follows the latest bars more closely). |
| Source | Close | The price the basis averages: Open, High, Low, Close, Mid, Typical or Average. |
| Colours and style | — | The Basis, Upper band, Lower band and Band fill colours; each line's width, dash and visibility under Lines in the Inspector. |
Example on gold#
For example, you set Percent to 2 on the daily chart while gold's 20-day average is $4,300, so the lines sit at $4,214 and $4,386. A fast rally then takes gold to $4,390, through the upper line, in three days. A mean-reversion trader reads that as stretched and waits for the first close back inside the envelope to sell towards the basis, with the stop above the rally high. A trend trader reads the same close as strength and would rather buy a pullback to the basis.
The envelope does not choose between them; the weekly trend does. A close that stays outside for days while the basis turns up tells the mean-reversion trader to stand aside. This is an illustration, not a signal.
Add it to your chart#
- Click Indicators in the top strip (on the Pro screen, press I).
- Type
envelopesand click Moving Average Envelopes, or press Enter for the first result. - Click its chip in the legend to open the Inspector and change the settings; drag the chip to reorder; the dot hides it; × removes it.
Related#
- Bollinger Bands — bands whose width follows volatility instead of a fixed percentage
- Keltner Channels — bands an ATR multiple from an exponential average
- Simple Moving Average — the basis on its own
- Exponential Moving Average — the other choice of basis
- Alerts — an alert when the price crosses a line of the envelope
- Adding and tuning indicators