Stochastic Momentum Index (SMI)
What the Stochastic Momentum Index measures, how to read its +40 and −40 levels and signal line, its settings on MillionChart and an example on gold.
The Stochastic Momentum Index (SMI) is a refinement of the Stochastic: instead of asking where the close sits between the low and the high of the last bars, it measures the close's distance from the middle of that range, smoothed twice. It is drawn in its own pane around zero, from −100 (the bottom of the range) to +100 (the top), with levels at +40 and −40. William Blau published it in 1993.
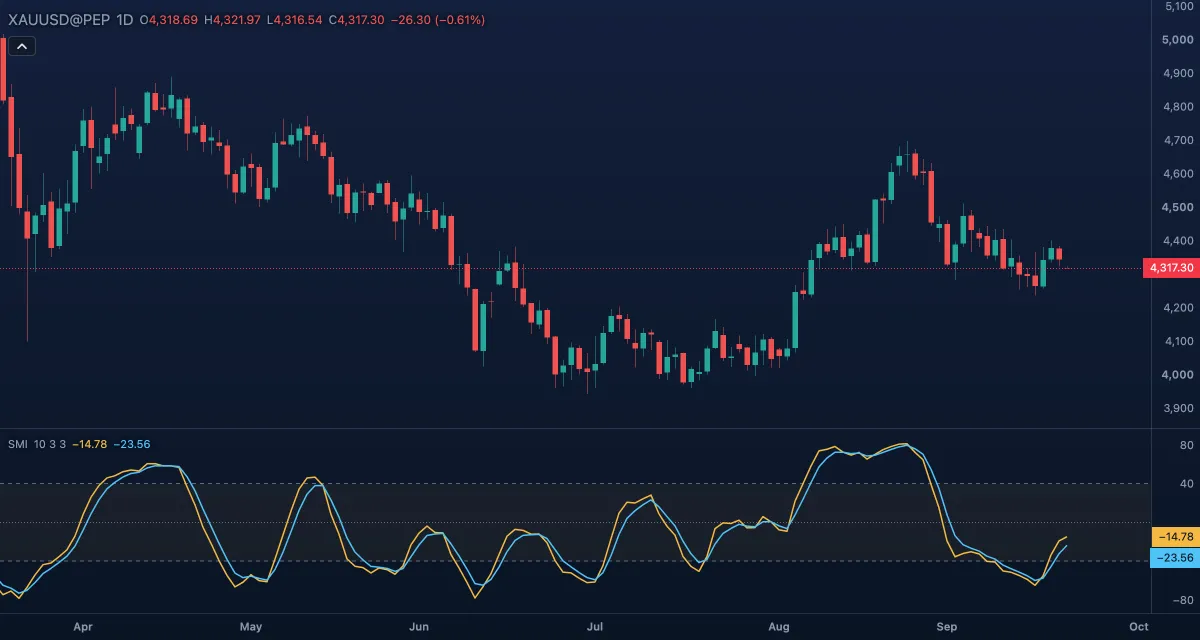
What it shows#
- SMI — the main line, in its own pane. Positive means the close is above the midpoint of the recent range, negative below it.
- Signal — a 3-bar exponential moving average of the SMI. The two crossing is the usual trigger.
- Upper and Lower — dashed levels at +40 and −40 with a light fill between them; beyond them the market is read as overbought or oversold.
- Zero — a dotted line at 0, the middle of the range.
How it is calculated#
For each bar the engine takes the highest high and the lowest low of the last %K length bars (10) and measures the close's distance from the middle of that range. The distance and the width of the range are each smoothed twice with exponential moving averages over the %D length (3). The SMI is the smoothed distance divided by half the smoothed width, times 100, so +100 is a close at the very top of the range and −100 at the bottom. The Signal is an exponential moving average of the SMI over the EMA length. The indicator always works on the high, low and close; it has no source setting.
How traders use it#
- Above +40 is overbought and below −40 oversold — a description of where the close sits, not a reversal signal; trends keep the line beyond the level for long stretches.
- The SMI crossing above its signal line from below −40 is a common buy trigger; crossing below it from above +40, a sell trigger.
- Divergence near the levels — a higher high in price with a lower high in the SMI — warns that the swing is ending.
- Watch out for: compared with the plain Stochastic the double smoothing gives fewer false crossings but a few bars more delay, and in a long trend the oversold readings keep failing.
Settings#
| Setting | Default | What it changes |
|---|---|---|
| %K length | 10 | Bars of the high–low range the close is compared with |
| %D length | 3 | Each of the two exponential smoothings of the distance and the range; higher is smoother |
| EMA length | 3 | Bars of the exponential moving average that makes the signal line |
| Colours and style | — | The colours of the SMI and Signal lines, the Upper level, Zero line and Lower level, and the Zone fill between the levels |
Example on gold#
Suppose gold has dropped from $4,350 to $4,260 in six daily candles and the SMI has fallen to −65. The next two candles close in the upper half of their ranges; the SMI turns up and crosses above its signal line while still below −40. For example, a trader looking to buy a dip in a larger uptrend could take that as the trigger, with a stop under the $4,255 low. The SMI crossing back below its signal line before reaching zero, or price breaking the low, would invalidate the idea.
Add it to your chart#
- Click Indicators in the top strip (on the Pro screen you can press I).
- Type
smiand click Stochastic Momentum Index. - Click its chip in the legend to open the Inspector and change the settings; drag the chip to reorder; the dot hides it; × removes it.
Related#
- Stochastic — the simpler close-in-range oscillator the SMI refines
- SMI Ergodic Indicator — a different Blau indicator with a similar name, built from price changes
- Williams %R — the close's position in the range, unsmoothed
- Alerts — an alert when the value crosses a level
- Adding and tuning indicators