Ultimate Oscillator (UO)
What the Ultimate Oscillator measures, why it blends three windows, how to read its 70 and 30 levels, its settings on MillionChart and an example on gold.
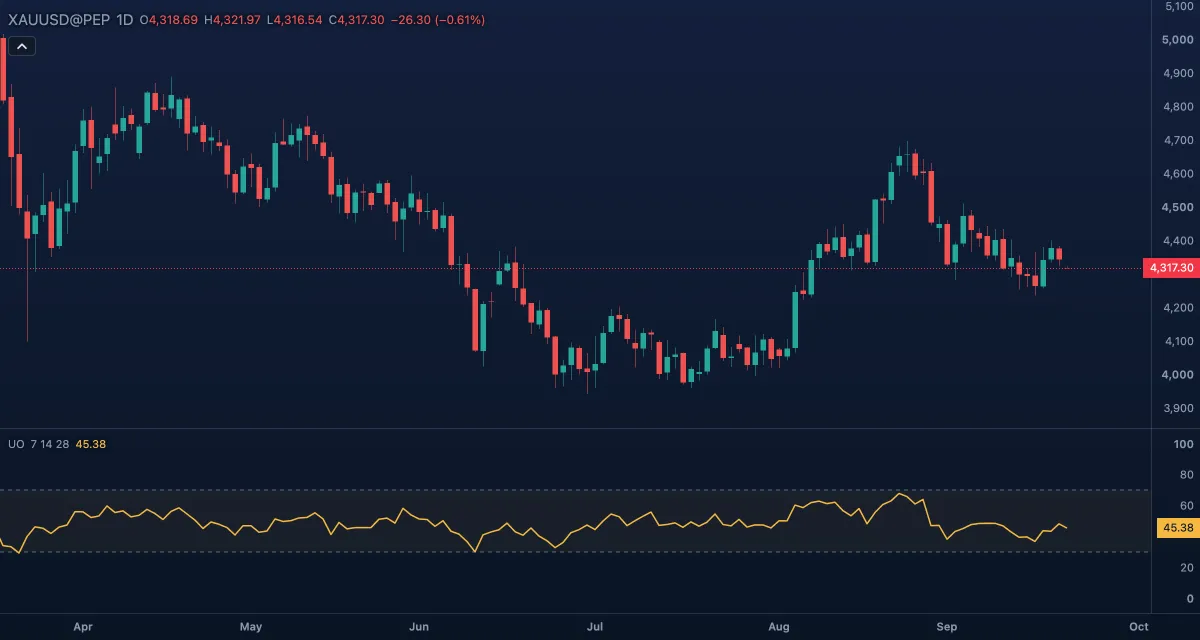
The Ultimate Oscillator measures buying pressure, how far each close sits above the bar's true low, as a share of the true range, over three windows at once: 7, 14 and 28 bars, weighted 4, 2 and 1. Larry Williams published it in 1985 as an answer to oscillators tied to a single length, which give false divergences. It runs in its own pane from 0 to 100.
What it shows#
- UO (gold line): rising when closes land near the top of their ranges, falling when they land near the bottom. Around 50 buying and selling are balanced.
- Upper (70) and Lower (30): dashed levels with a light fill between them, the zones Williams' rules read.
The pane is fixed to 0 to 100.
How it is calculated#
For each bar, buying pressure = close − the lower of the low and the previous close; true range = the higher of the high and the previous close − that same low. Both are summed over each of the three windows (Fast length, Middle length, Slow length), and each sum of buying pressure is divided by its sum of true range. UO = 100 × (4 × fast + 2 × middle + slow) / 7. The weights stay 4 : 2 : 1 whatever lengths you set. It uses the high, low and close; there is no source option.
How traders use it#
- Williams' buy rule: price makes a lower low while UO makes a higher low (a bullish divergence) with UO below 30 at the first low; buy when UO then rises above the highest point it reached during the divergence. The sell rule is the mirror image above 70.
- 70 and 30: above 70 is overbought and below 30 oversold. Because the long window damps the line, these readings are rarer than on RSI and carry more weight, but in a trend they are a warning, not a signal.
- Confirmation: a breakout with UO rising above 50 has closes near the highs behind it; one with UO falling does not.
- Divergence in general: each new price high with a lower UO high says buyers are closing bars less convincingly.
- Watch out for: in a strong trend the line can sit between 50 and 65 for weeks without reaching 70, and divergences can take many bars to resolve. The 28-bar window makes it slow.
Settings#
| Setting | Default | What it changes |
|---|---|---|
| Fast length | 7 | The shortest window, weighted 4. |
| Middle length | 14 | The middle window, weighted 2. |
| Slow length | 28 | The longest window, weighted 1; it sets how slow the line is. |
| Colours and style | — | The colour of the UO line, the two levels and the zone fill. |
The Upper and Lower levels are rows under Lines in the settings card; each has a Level box, so you can move them.
Example on gold#
Suppose gold falls to about $4,180 on the daily chart with UO dropping to 27, bounces, then falls again to $4,160, for example. At the second, lower low UO only reaches 34: a bullish divergence with the first low under 30. Williams' rule now waits: the buy comes when UO rises above the peak it made between the two lows, say 48, with a stop under $4,160. If price breaks $4,160 and UO makes a new low under 27 instead, the divergence has failed and the setup is off.
Add it to your chart#
- Click Indicators in the top strip (on the Pro screen, press I).
- Type
uoand click Ultimate Oscillator. - Click its chip in the legend to open the Inspector and change the settings; drag the chip to reorder; the dot hides it; × removes it.
Related#
- Relative Strength Index (RSI) — a single-window oscillator on the same scale
- Williams %R — the same author's range oscillator
- Stochastic — where the close sits in the recent range
- Alerts — an alert when UO crosses 30 or 70
- Adding and tuning indicators