Patterns
Head and shoulders, ABCD, XABCD and the Elliott impulse and correction: the points to click, the labels and ratios the chart prints, the settings.
Pattern tools draw a classic figure through the turning points you click and label it for you: the head and shoulders with its neckline, the ABCD and XABCD with their ratios, the Elliott impulse and correction with their wave numbers. In the Pro screen they have a Patterns tile of their own on the rail at the left; in Guided, open More tools (the tile with three dots) — the patterns are listed at the bottom. On a phone tap Draw, then Patterns, and read "tap" wherever this page says "click". The star next to a pattern puts it on the favourites bar over the chart. All five are drawn the same way: click the points in order, left to right; the figure grows as you click, every point stays a handle you can drag afterwards, Esc cancels, dragging the body moves the whole figure and a double-click opens the Inspector, the drawing's settings card. Shift does nothing special for these tools. The labels sit in small pills of the pattern's colour, above a turn that is a high and below one that is a low. A pattern is a drawing, not a detector: the chart does not find patterns for you, and it does not check that your points obey the textbook rules. For selecting, locking, hiding and undo see Drawing on the chart.
Head and shoulders#
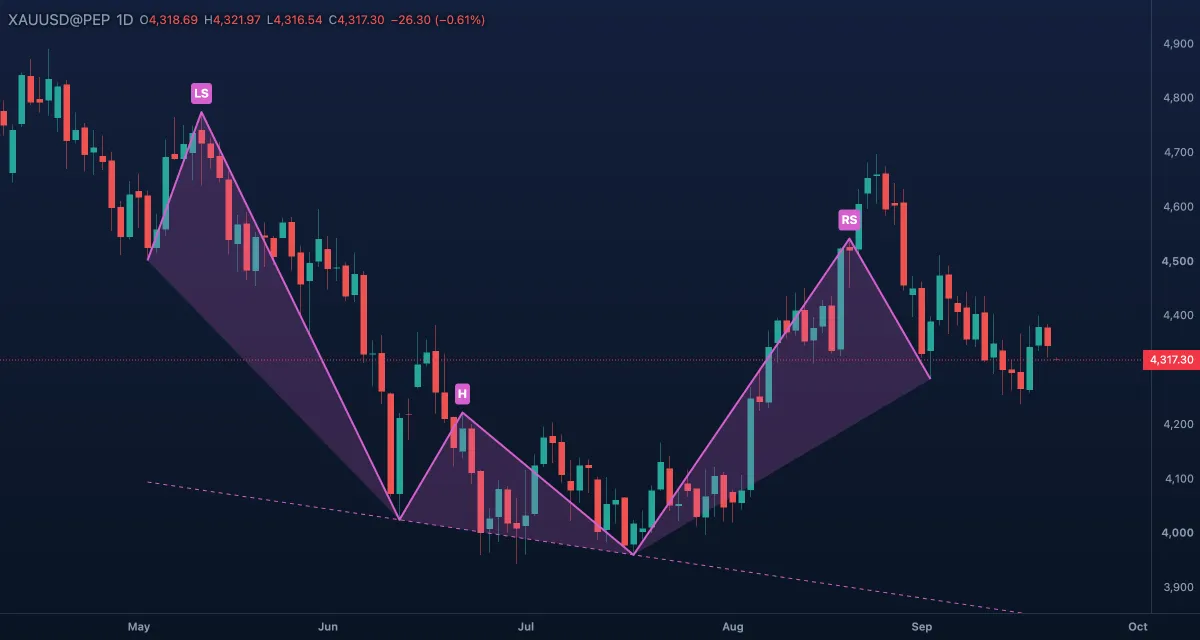
What it draws. Seven points, left to right: left base, left shoulder, first neckline point, head, second neckline point, right shoulder, right base. The line through them, the labels LS, H and RS, a dashed neckline through the two neckline points (Extend neckline right runs it to the chart's edge) and a light fill between the figure and the neckline.
What it is for. The top that often ends an uptrend: a high, a higher high, then a lower high that cannot reach the head. The neckline is the trigger: a close below it completes the pattern, and the head's height above the neckline is the usual target below the break. Upside down it is the inverse pattern at a bottom. Not every three bumps qualify: look for a clear trend before it and a real neckline.
How to draw it. Click the seven turning points, left to right; the neckline appears after the fifth click. Drag any point to adjust it, the body to move it all; a double-click opens the Inspector.
Settings. Line (magenta), Line width 2 (1 to 4), Fill, Extend neckline right on, Point labels on, Label text (white), Font size 12 (8 to 28).
Example. On daily gold after a long rise, put LS, H and RS on the three highs and the neckline points on the lows between them; then watch for the close below the neckline.
ABCD pattern#
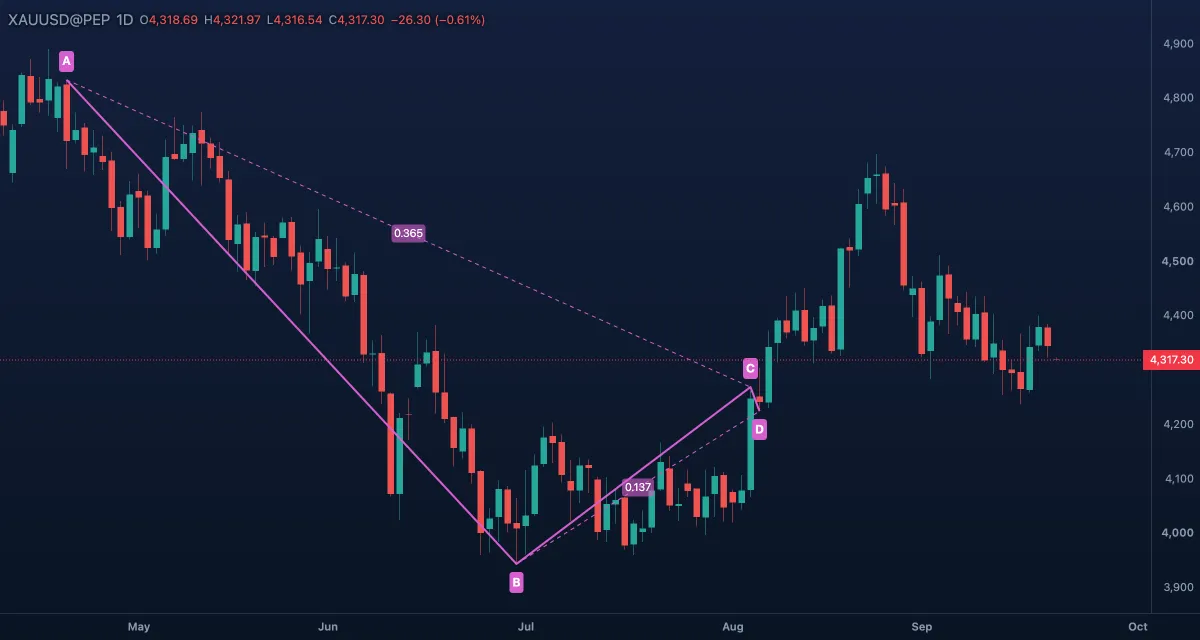
What it draws. Four points A, B, C and D joined by a line, with dashed connectors A–C and B–D. A pill on each prints a ratio of price legs with three decimals: BC/AB (how deep the pullback went; 0.618 is a 61.8 % retracement) and CD/BC (how far the last leg ran compared with the pullback). A flat leg prints no ratio.
What it is for. The simplest harmonic figure: two legs in the same direction, AB and CD, separated by a pullback BC. Traders look for CD to end at a Fibonacci multiple of BC — 1.272 or 1.618 are the classic numbers — and D is where the second leg may end and the trade is taken. The ratios save you a calculator; they do not promise the turn.
How to draw it. Click the points A, B, C and D; the first ratio appears after the third click. Drag a point and the ratios update at once; a double-click opens the Inspector.
Settings. Line (magenta), Line width 2, Point labels on, Label text (white), Font size 12, Ratios on. No fill.
Example. Gold drops from A to B, pulls back to C with BC/AB near 0.618, then drops again. Put D where CD/BC reads about 1.272: a measured level at which to look for a bottom.
XABCD pattern#
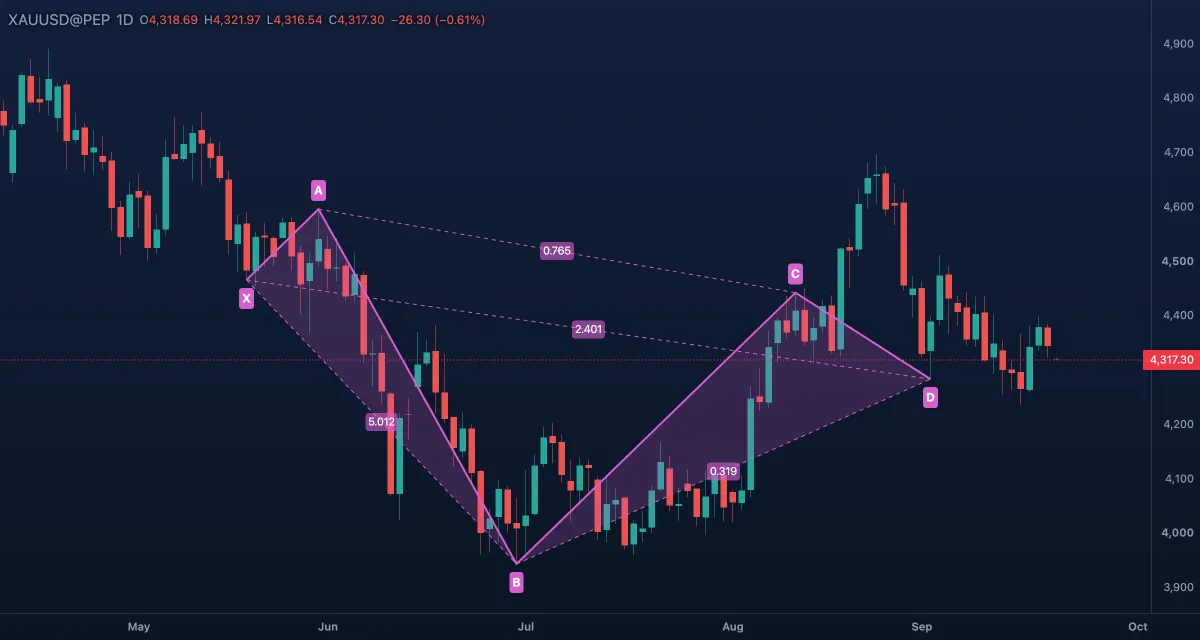
What it draws. Five points X, A, B, C and D with the line through them, two shaded triangles (XAB and BCD) and four dashed connectors with ratio pills — AB/XA on X–B, BC/AB on A–C, CD/BC on B–D, AD/XA on X–D — each a price ratio with three decimals.
What it is for. The harmonic patterns — Gartley, Bat, Butterfly, Crab and the rest — five-point figures that differ only in their ratios. D is the turning zone where the pattern completes and a trade is looked for. The chart prints the four ratios such a pattern is defined by; you compare them with the textbook numbers (a Gartley wants B near 0.618 of XA and D near 0.786 of XA). The chart does not name the pattern for you.
How to draw it. Click X, A, B, C and D in order; the second triangle and the last two ratios appear with the fifth click. Drag any point and the ratios follow; a double-click opens the Inspector.
Settings. Line (magenta), Line width 2, Fill (the two triangles), Point labels on, Label text (white), Font size 12, Ratios on.
Example. After a gold rally X–A and a pullback to B, mark the bounce to C and the drop to D. With AD/XA near 0.786 and CD/BC near 1.272, the ratios fit a bullish Gartley at D.
Elliott impulse (1-2-3-4-5)#
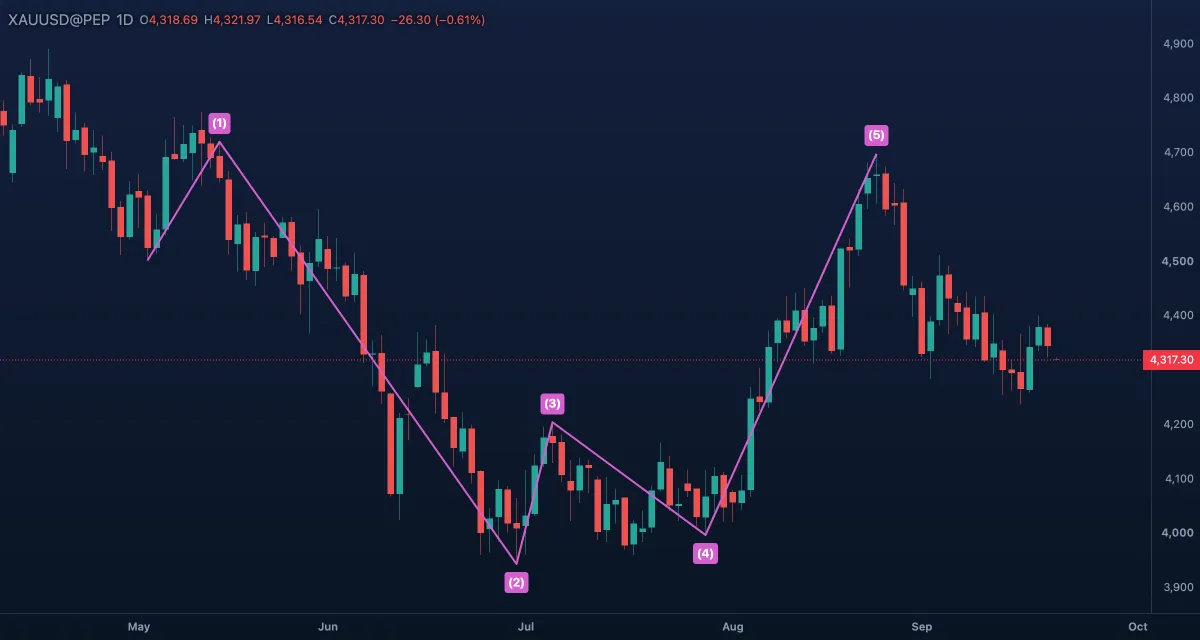
What it draws. Six points: the start of the move, then the end of each of the five waves. A line through them with the labels (1) to (5) at the wave ends; the start carries no label.
What it is for. An Elliott impulse: five waves with the trend — three pushes (1, 3, 5) and two pullbacks (2, 4). The rules traders check: wave 2 does not go below the start of wave 1, wave 3 is never the shortest and is usually the longest, wave 4 does not overlap wave 1. The chart draws what you click and checks none of them; treat a count as a hypothesis, not a fact.
How to draw it. Click the start, then the end of each of the five waves. Drag any point to change the count, the body to move the whole figure; a double-click opens the Inspector.
Settings. Line (magenta), Line width 2, Point labels on, Label text (white), Font size 12. No fill, no ratios.
Example. On a gold uptrend, mark the low where it began and the five turns after it. If the third leg is the longest and the fourth stays above the first high, the count is plausible; the correction tool is the next thing to draw.
Elliott correction (A-B-C)#
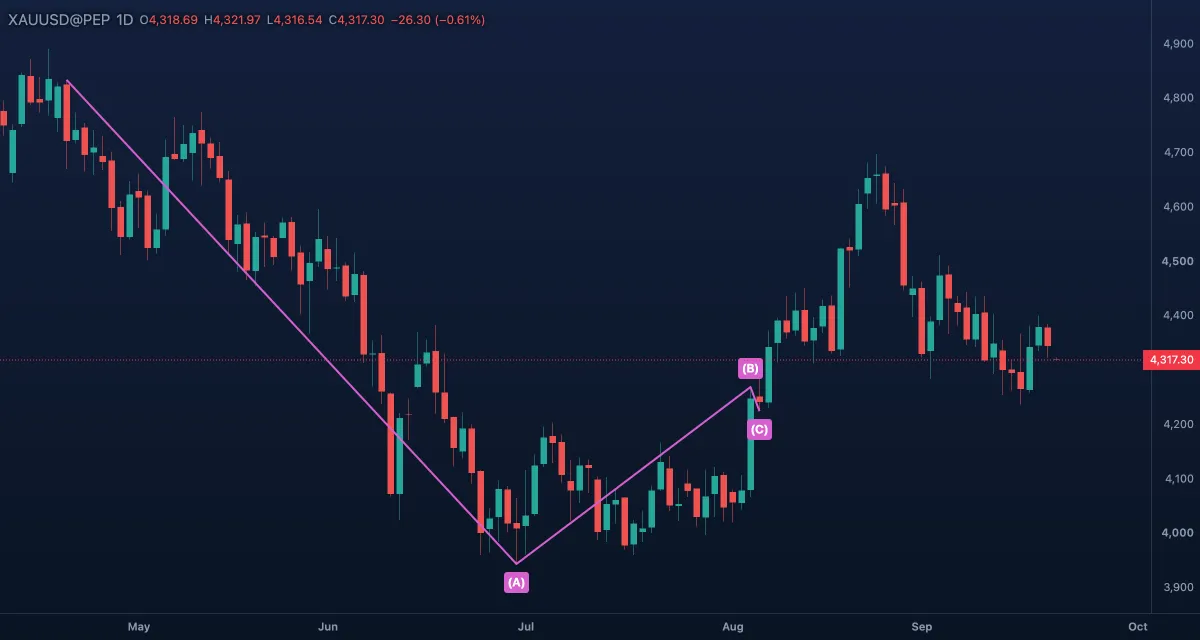
What it draws. Four points: the start, then the ends of the waves A, B and C, labelled (A), (B) and (C) along the line through them.
What it is for. The three waves against the trend that usually follow an impulse: A down, B up — a bounce that often fools people into buying — and C down, after which the trend may resume. The common way to set a target is to measure C against A (equal legs, or 1.618 times A); this tool prints no ratios, so do that with the Fibonacci tools.
How to draw it. Click the start, then A, B and C. Drag any point to adjust it, the body to move the figure; a double-click opens the Inspector.
Settings. Line (magenta), Line width 2, Point labels on, Label text (white), Font size 12. No fill.
Example. When a gold rally stalls, mark the top as the start, the first drop as A, the bounce as B and the next drop as C. If C ends near the equal-leg level and the price turns there, the correction is probably over.