Average Directional Index (ADX)
What ADX measures, how to read the 25 level, how it is built from +DI and −DI, its settings on MillionChart and a worked example on gold.
ADX measures the strength of a trend without saying which way it points: a rising ADX means the market is trending, up or down, and a low ADX means it is drifting. It runs from 0 to 100 but lives mostly below 60. J. Welles Wilder Jr. introduced it in New Concepts in Technical Trading Systems (1978) as the summary line of his Directional Movement system.
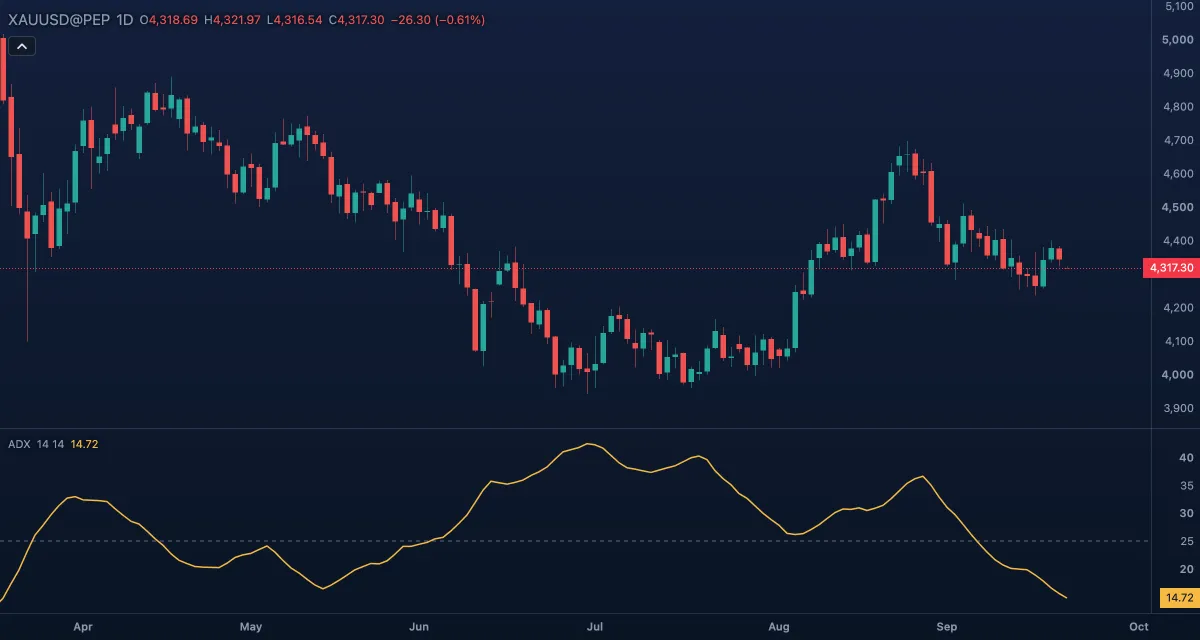
What it shows#
- ADX — one line in its own pane. Rising means the trend, whichever way it points, is getting stronger; falling means it is losing strength or the market has gone sideways.
- Trend level (25) — a dashed line: above it the market is usually read as trending, below it as ranging.
- The pane scales to the values, so the line uses the whole height although its scale is 0 to 100.
How it is calculated#
Each bar's directional movement is how far the high rose above the previous high (+DM) or how far the low fell below the previous low (−DM); only the larger of the two counts, and only if it is positive. Both are smoothed with Wilder's smoothing over the DI length and divided by the smoothed true range, giving +DI and −DI. DX = 100 × |+DI − −DI| / (+DI + −DI) is how one-sided the movement was, and ADX is DX smoothed again over ADX smoothing. The two smoothings are why ADX turns late.
How traders use it#
- Above 25: a trend is in force; moving-average and breakout methods work, and counter-trend fades do not.
- Below 20: a range; oscillators such as RSI and support-and-resistance trades work better, and crossovers whipsaw.
- Rising from under 20 through 25: a new trend is starting; the direction comes from price, or from +DI and −DI on the DMI.
- Falling from a high reading (40 and above): the trend is tiring. That is not a reversal signal; a strong trend can pause, let ADX drop, and resume.
- Watch out: ADX has no direction and lags by design. A high ADX at the end of a long move often marks the climax, not the start; read it with the candles, not instead of them.
Settings#
| Setting | Default | What it changes |
|---|---|---|
| DI length | 14 | The smoothing of +DM, −DM and the true range that makes +DI and −DI (1 to 5,000). |
| ADX smoothing | 14 | The second smoothing, of DX into ADX (1 to 5,000). Larger is smoother and slower. |
| Colours and style | — | The ADX line and Trend level colours. |
Example on gold#
Gold has ranged between $4,200 and $4,260 for a month and the daily ADX (14, 14) sits near 15. Price then closes above $4,260 and the ADX turns up, crossing 25 a week later while the candles keep making higher lows. For example, a trader who has been fading the range stops fading, and switches to buying pullbacks with the trend as long as ADX keeps rising.
What would invalidate it: ADX rolling over below 25 soon after the cross, with price slipping back into the old range. The breakout did not grow into a trend.
Add it to your chart#
- Click Indicators in the top strip (on the Pro screen, I does the same).
- Type
adxand click the indicator. - Click its chip in the legend to open the Inspector and change the settings; drag the chip to reorder; the dot hides it; × removes it.
Related#
- Directional Movement Index — the same calculation with +DI and −DI shown, for the direction
- Aroon — trend from the timing of new highs and lows instead of their size
- Choppiness Index — another trending-or-ranging gauge
- Alerts — an alert when ADX crosses 25
- Adding and tuning indicators