Money Flow Index (MFI)
What the Money Flow Index measures, its 0–100 range with the 80 and 20 levels, its settings on MillionChart and an example on gold.
The Money Flow Index is a volume-weighted RSI. It compares the money that flowed in on candles whose typical price rose with the money that flowed out on candles whose typical price fell, over the last 14 candles, and scales the result from 0 to 100. Above 80 is the overbought reading, below 20 the oversold one. Gene Quong and Avrum Soudack published it in Technical Analysis of Stocks & Commodities in 1989.
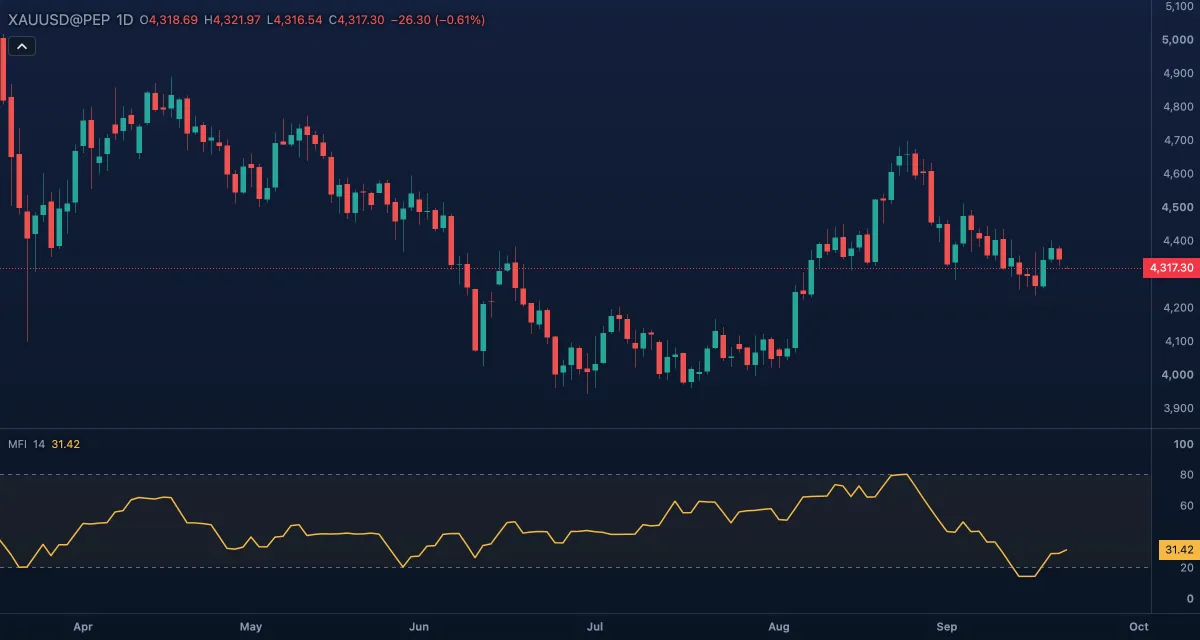
What it shows#
- MFI — a gold line in its own pane with a fixed scale from 0 to 100. High values: most of the recent volume-weighted price change came on rising candles; low values: on falling ones.
- Overbought at 80 and Oversold at 20 — dashed lines with a faint fill between them. Readings outside that zone are the extremes.
- 100 means the window had no falling candle; 0, no rising one.
How it is calculated#
The typical price is (high + low + close) / 3, and a candle's raw money flow is its typical price times its volume. The flow counts as positive when the typical price is above the previous candle's and negative when it is below. MFI = 100 − 100 / (1 + Σ(positive flow over Length) / Σ(negative flow over Length)). The first value needs Length + 1 candles, because the first candle has no previous price.
How traders use it#
- Overbought and oversold: above 80 the recent flow has been one-sided to the upside — a caution for new longs, not a sell signal by itself; below 20, the mirror. In a strong trend MFI can stay beyond the level for weeks.
- Leaving the extremes: the drop back below 80, or the rise back above 20, is the reading many traders act on, rather than the first touch.
- Divergence: price at a new high with MFI at a lower high — the money behind the move is thinning — is its best-known use; the mirror applies at lows.
- Watch out for: like RSI it stays pinned in a trend; the 14-candle window drops candles abruptly; on gold and forex the volume is tick volume, so "money" is activity-weighted price change. Compare it with RSI: when the two disagree, volume is the reason.
Settings#
| Setting | Default | What it changes |
|---|---|---|
| Length | 14 | Candles in the window. Shorter reaches 80 and 20 more often; longer, rarely. |
| Colours and style | — | MFI (the line), Overbought level, Oversold level and Zone fill; the levels' rows under Lines in the Inspector hold their colour, style and level value. |
Example on gold#
Suppose gold on daily candles rallies from $4,200 to $4,340 in three weeks and MFI reaches 86. For example, a trader with a long does not sell on that number — it only says the recent flow was one-sided — but when MFI drops back under 80 while price makes one more marginal high at $4,348, they take partial profit and move the stop up to $4,300.
What invalidates the caution: MFI turning back up above 80 with price clearing $4,350 on a wide candle — the flow is one-sided again, and the trend is simply strong.
Add it to your chart#
- Click Indicators in the top strip (on the Pro screen, press I).
- Type
mfiand click Money Flow Index, or press Enter for the first result. - Click its chip in the legend to open the Inspector and change the settings; drag the chip to reorder; the dot hides it; × removes it.
Related#
- Relative Strength Index — the same formula on price alone; compare the two
- Chaikin Money Flow — money flow by the close's place in the range, from −1 to +1
- Volume — the columns that weight the flow
- Alerts — an alert when MFI crosses 80 or 20
- Adding and tuning indicators