True Strength Index (TSI)
What the True Strength Index measures, how to read its two lines, its settings on MillionChart and a worked example on gold.
The True Strength Index (TSI) is a momentum oscillator built from bar-to-bar price changes, smoothed twice with exponential moving averages so that it follows the trend with little noise. It is drawn in its own pane around a zero line; the scale is −100 to +100 in theory, though the line usually stays well inside those bounds. William Blau published it in 1991.
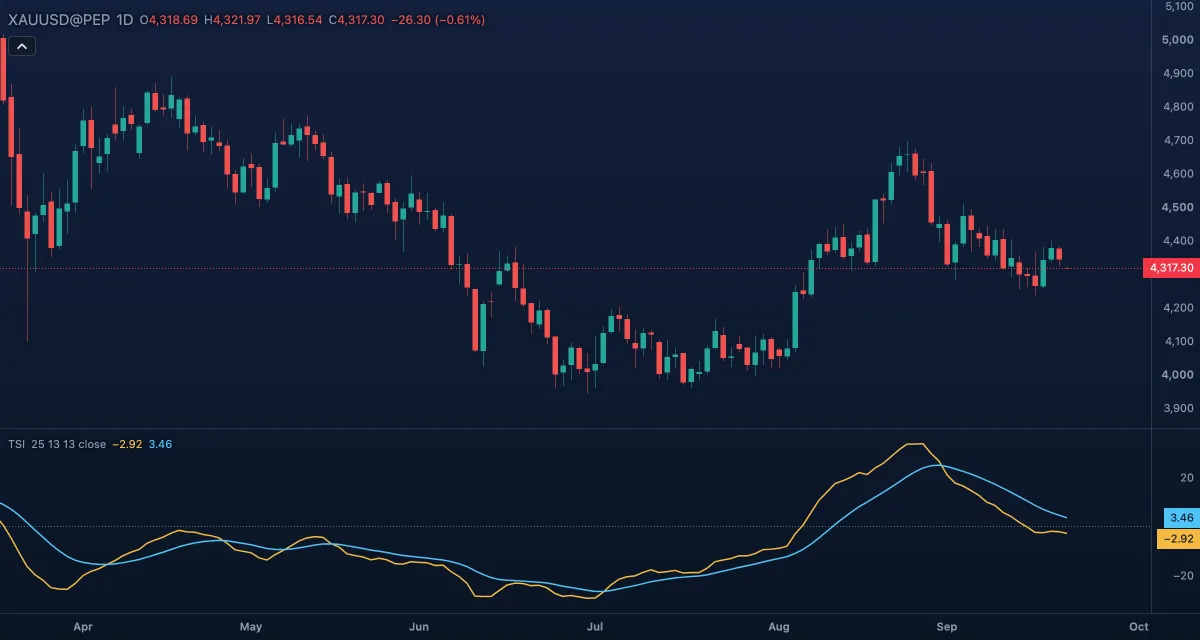
What it shows#
- TSI — the main line, in its own pane. Above zero price has been rising on balance over the two smoothing lengths, below zero falling; rising means momentum is strengthening.
- Signal — a 13-bar exponential moving average of the TSI. The two lines crossing is the usual trigger.
- Zero — a dotted level at 0.
How it is calculated#
Each bar's change in the Source (the close minus the previous close, by default) is smoothed with an exponential moving average over the Long length (25), then again over the Short length (13). The absolute value of the change is smoothed the same way. The TSI is the first divided by the second, times 100: the net movement as a share of the total movement (0 when price has not moved at all). The Signal is an exponential moving average of the TSI over the Signal length.
How traders use it#
- TSI above zero marks rising momentum, below zero falling momentum; a zero crossing is a slow but clear change of state.
- TSI crossing above its signal line is a buy trigger and crossing below a sell trigger, usually taken only on the matching side of zero.
- Blau set no fixed overbought and oversold lines; traders mark their own, often around +25 and −25 on daily charts, and treat a turn from there as a warning rather than a signal.
- Divergence — price at a new high with the TSI at a lower high, or the reverse — is one of the cleaner readings, because the double smoothing removes much of the noise.
- Watch out for: the two long smoothings make the TSI late; a trend can reverse several bars before the lines cross, and in a flat market the crossings pile up around zero.
Settings#
| Setting | Default | What it changes |
|---|---|---|
| Long length | 25 | The first exponential smoothing of the price changes; longer is smoother and slower |
| Short length | 13 | The second smoothing, applied to the result of the first |
| Signal length | 13 | Bars of the exponential moving average that makes the signal line |
| Source | Close | The price whose bar-to-bar change is measured: Close, Open, High, Low, Mid, Typical or Average |
| Colours and style | — | The colours of the TSI and Signal lines and of the Zero line |
Example on gold#
Suppose gold has ground higher from $4,150 to $4,300 over a month and the TSI has held between +15 and +30. Price pushes to a new high at $4,320 while the TSI peaks lower than it did two weeks earlier. For example, a trader could read that divergence as a reason not to chase the new high, and wait for the TSI to cross below its signal line before trimming a long position. The TSI breaking above its earlier peak would remove the divergence; a drop through zero would be the later, stronger sign that the uptrend has ended.
Add it to your chart#
- Click Indicators in the top strip (on the Pro screen you can press I).
- Type
tsiand click the indicator. - Click its chip in the legend to open the Inspector and change the settings; drag the chip to reorder; the dot hides it; × removes it.
Related#
- SMI Ergodic Indicator — the same calculation on a −1 to +1 scale with shorter defaults
- Relative Strength Index — the classic momentum oscillator with fixed 30 and 70 levels
- MACD — momentum from two moving averages, with a signal line
- Alerts — an alert when the value crosses a level
- Adding and tuning indicators