Connors RSI (CRSI)
What Connors RSI combines (a short RSI, a streak RSI and a percent rank), how to read its 90 and 10 levels, its settings and an example on gold.
Connors RSI is a fast oscillator built for short-term mean reversion. It averages three readings: a 3-bar RSI of the price, a 2-bar RSI of the streak of up and down closes, and the percent rank of the latest one-bar change against the last 100. Larry Connors, Cesar Alvarez and Matt Radtke published it in 2012. It runs in its own pane from 0 to 100, with levels at 90 and 10.
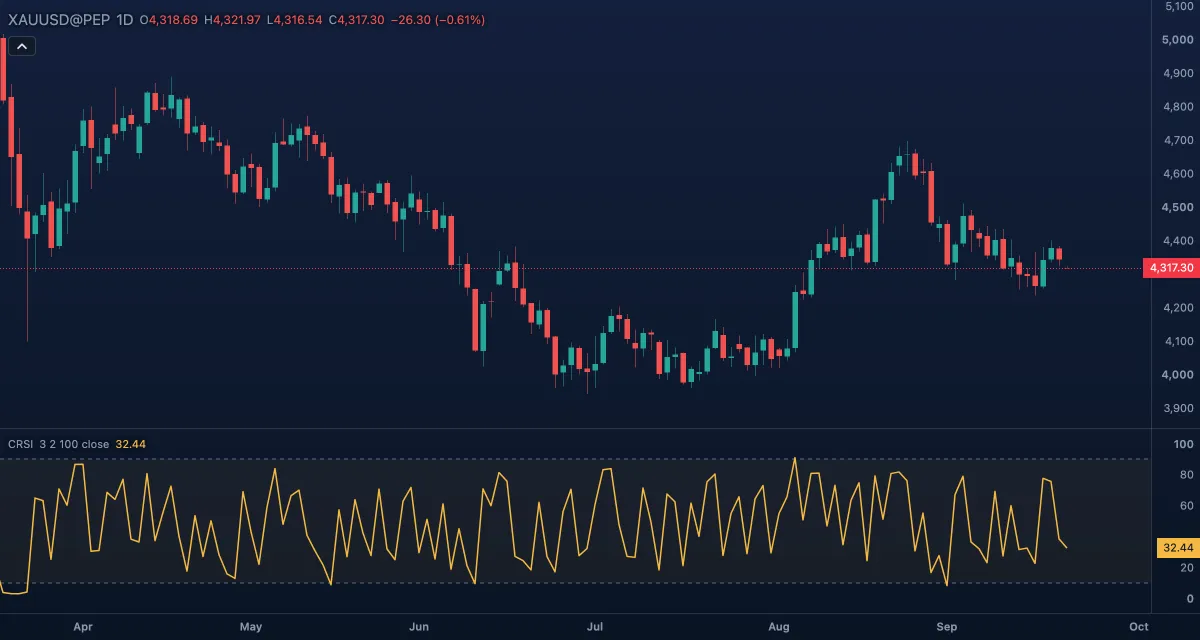
What it shows#
- CRSI (gold line): high when the price has risen for several bars in a row and the latest gain is large by recent standards; low when the reverse. It moves from one extreme to the other within a few bars.
- Upper (90) and Lower (10): dashed levels with a light fill between them. Beyond them the market is stretched in the short term.
The pane is fixed to 0 to 100.
How it is calculated#
Three parts, averaged with equal weight:
- An RSI of the source over RSI length bars (3).
- The streak: +1, +2, +3 … for each consecutive close above the previous one, −1, −2 … for each consecutive lower close, 0 on an unchanged close. An RSI of that streak over Streak RSI length bars (2).
- The percent rank of the latest one-bar percent change among the previous Percent rank length changes (100): the share of them that are lower than or equal to it.
CRSI = (RSI + streak RSI + percent rank) / 3. The percent rank needs about 100 bars of history before the first value appears. The 90 and 10 levels are MillionChart's choice of extremes for a fast 0 to 100 index.
How traders use it#
- Mean reversion: the authors' strategies buy an instrument in an uptrend when CRSI falls into the single digits and sell it when CRSI climbs into the 90s. The chart's 10 and 90 levels mark these zones.
- Trend filter: use it with the larger trend, for example price above a 200-bar simple moving average, and take only the low readings in an uptrend and the high readings in a downtrend.
- Timing, not direction: it reaches its extremes often. It times an entry or an exit over a few bars; it is not a trend indicator.
- The streak part: three or four up-closes in a row push the reading up fast even when each gain is small.
- Watch out for: on short timeframes a single news bar sends it to an extreme and back, and a symbol with little history shows nothing until 100 bars exist.
Settings#
| Setting | Default | What it changes |
|---|---|---|
| RSI length | 3 | Bars of the price RSI. |
| Streak RSI length | 2 | Bars of the RSI applied to the up/down streak. |
| Percent rank length | 100 | How many previous one-bar changes the latest one is ranked against. |
| Source | Close | The price used: Open, High, Low, Close, Mid (HL2), Typical (HLC3) or Average (OHLC4). |
| Colours and style | — | The colour of the CRSI line, the two levels and the zone fill. |
The Upper and Lower levels are rows under Lines in the settings card; each has a Level box, so you can move them, to 95 and 5 for example.
Example on gold#
Suppose gold is in an uptrend on the daily chart, above its 200-bar average, and drops three sessions in a row from about $4,300 to $4,230, the last the largest fall in weeks, for example. CRSI reads 6: a short, sharp pullback inside an uptrend, the setup the indicator was built for. A trader might buy near the close of that bar with a stop under $4,200 and plan to exit within a few sessions, once CRSI is back above 50. A fourth down session that breaks $4,200 and the 200-bar average would show the pullback has turned into something larger.
Add it to your chart#
- Click Indicators in the top strip (on the Pro screen, press I).
- Type
crsiand click Connors RSI. - Click its chip in the legend to open the Inspector and change the settings; drag the chip to reorder; the dot hides it; × removes it.
Related#
- Relative Strength Index (RSI) — the slower index this one starts from
- Rate of Change — the one-bar change its percent rank uses
- Simple Moving Average — the usual trend filter for its signals
- Alerts — an alert when CRSI crosses 10 or 90
- Adding and tuning indicators