Stochastic
What the stochastic oscillator's %K and %D lines show, the 80 and 20 levels, its settings on MillionChart and an example on gold.
The stochastic oscillator shows where the latest close sits inside the range of the last bars: 100 means the close is at the top of that range, 0 at the bottom. The idea is that closes gather near the highs while a rise is strong and sink towards the lows when it weakens. George Lane popularised it in the 1950s.
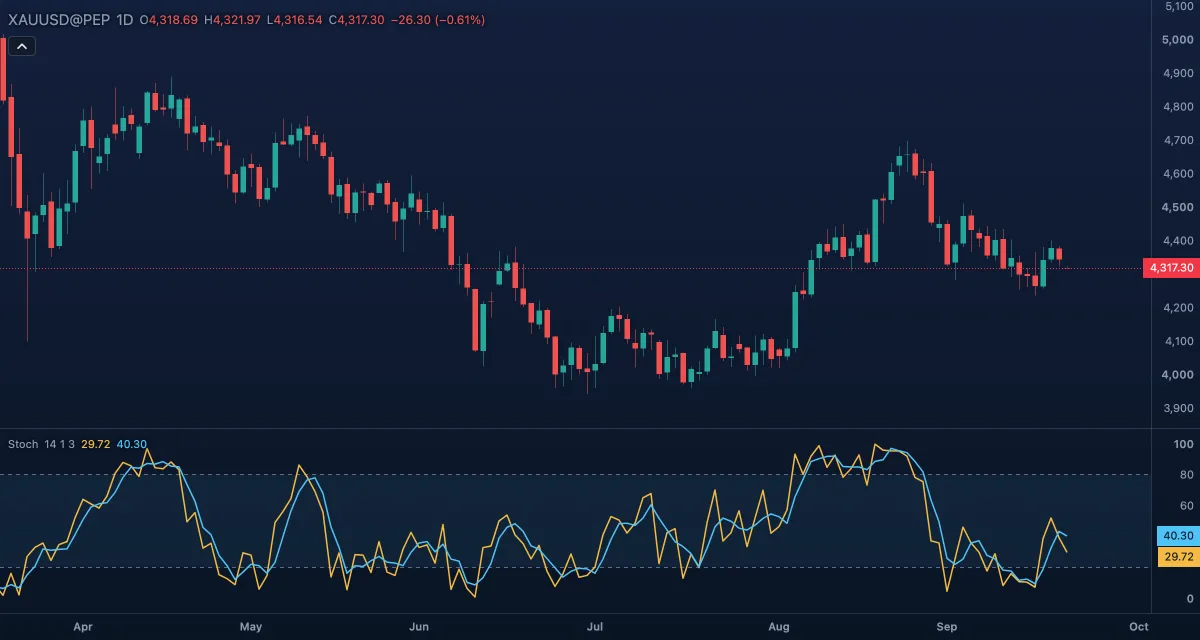
What it shows#
- %K — the gold line in its own pane, on a fixed 0 to 100 scale: the position of the close inside the range of the last %K length bars. Rising means the closes are moving up through the range.
- %D — the blue line, a 3-bar average of %K; the crosses of the two lines are the usual trigger.
- Upper — a dashed level at 80; Lower — a dashed level at 20.
- Zone fill — a faint tint between 80 and 20.
How it is calculated#
The chart takes the highest high and the lowest low of the last %K length bars (14) and places the close inside that range: 100 × (close − lowest low) / (highest high − lowest low). That raw value is averaged over %K smoothing bars to give %K, and %K over %D length bars to give %D, both with simple averages. With the default smoothing of 1, %K is the raw value — the fast stochastic; set %K smoothing to 3 for the slow stochastic that many charts show by default. There is no Source setting: the indicator reads the high, low and close of each bar. A flat window has no value.
How traders use it#
- Above 80 the close is near the top of its recent range, below 20 near the bottom. These mark stretched moves, not turns: in a range, buying the oscillator's lows and selling its highs works; in a trend the lines stay pinned at one end for long stretches, so use only the signals in the trend's direction.
- The cross: %K crossing above %D under 20 is the classic buy reading, crossing below %D above 80 the sell reading. Crosses in the middle of the scale count for less.
- Divergence between the price and %K, as with RSI, warns that a move is tiring.
- Watch out: the fast version whipsaws, especially on short timeframes. Smooth or lengthen %K before trusting a cross on its own, and never read a level as a signal while the price is making new highs or lows.
Settings#
| Setting | Default | What it changes |
|---|---|---|
| %K length | 14 | Bars of the range the close is measured against. Longer is calmer and reaches the levels less often. |
| %K smoothing | 1 | Bars %K is averaged over. 1 is the fast stochastic; 3 is the slow one. |
| %D length | 3 | Bars %D is averaged over — how far the signal line trails %K. |
| Colours and style | — | The colours of %K, %D, the Upper level, the Lower level and the Zone fill; widths and dash under Look in the Inspector. |
Example on gold#
Gold has moved sideways, for example, between $4,200 and $4,350 for a month on the daily chart. Near the bottom of that range, at about $4,210, the stochastic (14, 1, 3) dips under 20 and then %K crosses back above %D. For a range trader that is a reading for a bounce towards the middle, with a stop a little under $4,200 and a first target near $4,280.
What would invalidate it: a daily close below $4,200. The range is then broken, and a stochastic under 20 no longer means a cheap price — it stays pinned there while the price falls.
Add it to your chart#
- Click Indicators in the top strip (on the Pro screen, press I).
- Type
stochand click the indicator, or press Enter for the first result. - Click its chip in the legend to open the Inspector and change the settings; drag the chip to reorder; the dot hides it; × removes it.
Related#
- RSI — the other common bounded oscillator, smoothed where the stochastic is raw
- Stochastic RSI — the same formula applied to RSI
- Williams %R — the same range reading upside down, from 0 to −100
- Alerts — an alert when %K crosses 80 or 20
- Adding and tuning indicators