Median Price
What the median price line is, how it is calculated from each bar's high and low, its setting on MillionChart and an example on gold.
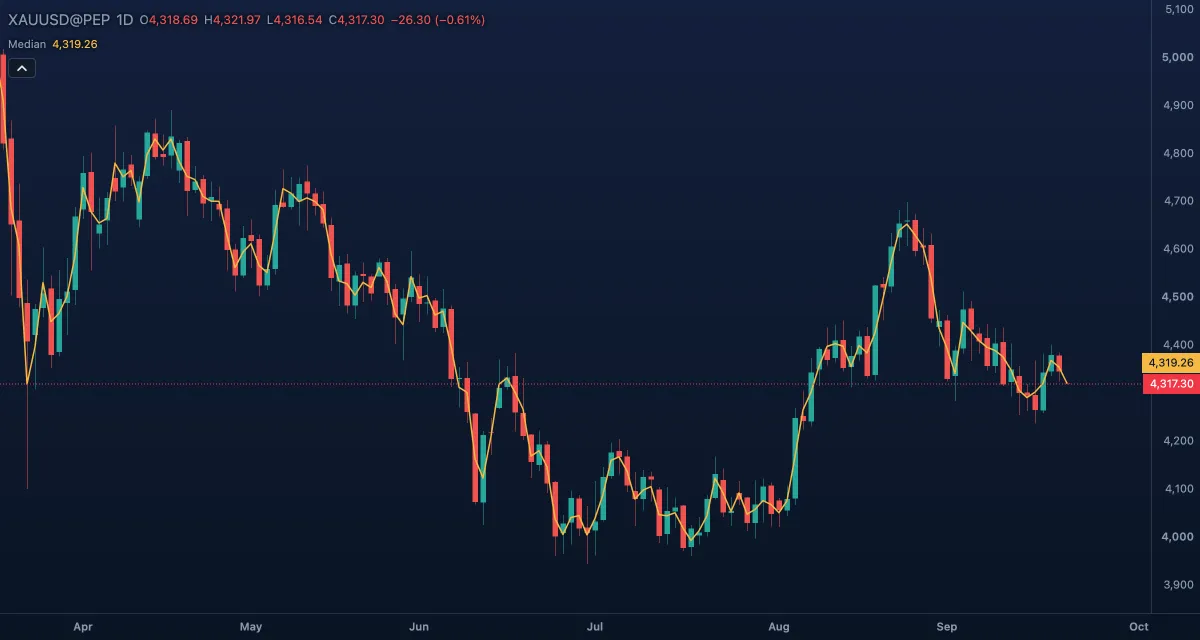
Median Price draws one line over the candles: the midpoint of each bar, halfway between its high and its low. It is the simplest summary of a bar — where the middle of the trading was, ignoring where it opened and closed — and the hl2 source other indicators can be fed with.
What it shows#
- Median — a thin gold line through the middle of each candle's range. It rises when the whole range shifts up, whatever the close did.
- Because it ignores the close, it is calmer than a line of closes: a bar that reverses hard inside its range leaves the median where the range is, not where the bar ended.
How it is calculated#
Median price = (high + low) / 2, for every bar. There is no length and no smoothing; a bar missing its high or low gets no value.
How traders use it#
- As a source: in the Inspector of a moving average, RSI or any other indicator, choose Mid as the source to calculate it on the median instead of the close; the result is smoother and less jumpy at the close of each bar.
- As a quick line of the range: on a thin or spiky chart the median shows the direction of the trading range more plainly than the closes do.
- Compared with the close: a close consistently above the median (bars closing in their upper half) is buying pressure; below it, selling pressure.
- Watch out for what it hides: a bar that closed at its low and a bar that closed at its high can have the same median. For the close's story, use the close.
Settings#
| Setting | Default | What it changes |
|---|---|---|
| Colours and style | — | Median price: the line's colour, width and type under Lines in the Inspector. There are no calculation inputs. |
Example on gold#
For example, over five daily bars gold's medians read $4,286, $4,291, $4,298, $4,304 and $4,310 while two of those days closed red: the middle of the trading kept moving up even on the days that ended lower, which supports the view that the pullbacks were being bought. A trader using a 20-period EMA on Mid as the trend line would stay long while the medians hold above it; a run of falling medians, with closes in the lower half of their bars, would say the pressure has changed.
Add it to your chart#
- Click Indicators in the top strip (on the Pro screen, press I).
- Type
medianand click the indicator. - Click its chip in the legend to open the Inspector and change the settings; drag the chip to reorder; the dot hides it; × removes it.
Related#
- Typical Price — the same idea with the close included
- SMA and EMA — averages that can be fed with the median as their source
- Alerts — an alert when the price crosses the line
- Adding and tuning indicators