Average True Range (ATR)
What ATR measures, how to size stops and positions with it, its setting on MillionChart and an example on gold.
The Average True Range measures how far the price moves in a bar, on average, in the symbol's own price units: dollars for gold. It says nothing about direction, only about the size of the moves. J. Welles Wilder Jr. published it in 1978.
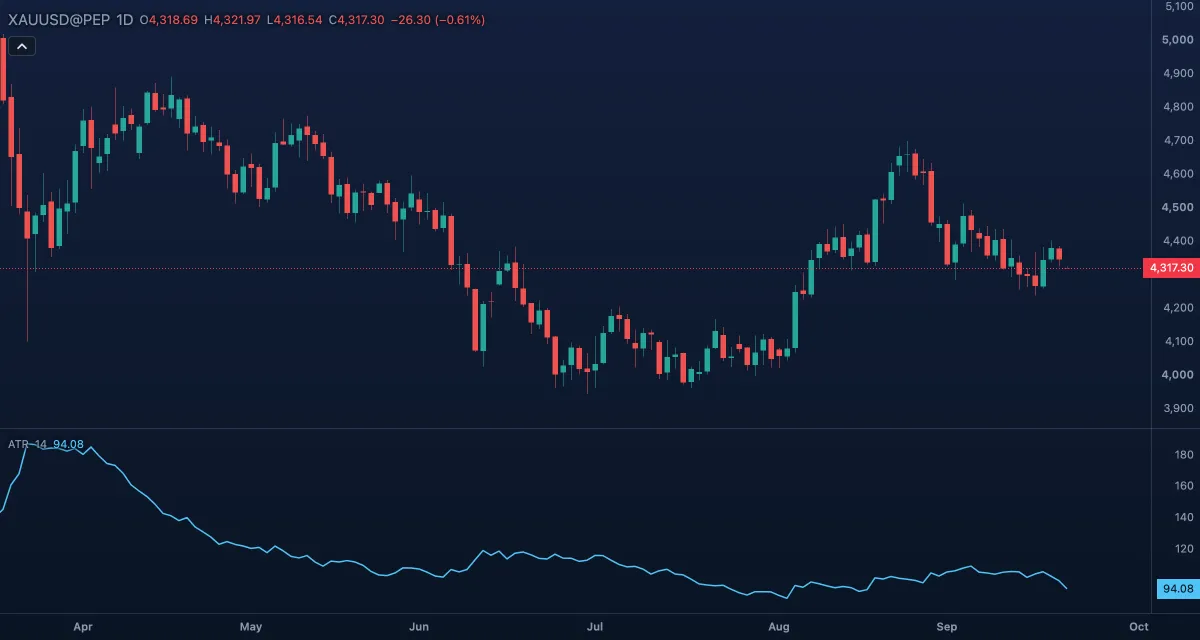
What it shows#
- ATR — one line in its own pane, printed with the symbol's digits, never negative. Rising means the bars are getting bigger; falling means the market is calming down. A long flat stretch at a low level is a quiet market.
How it is calculated#
A bar's true range is the largest of three distances: its high minus its low, its high minus the previous close, and its low minus the previous close, so a gap between two bars counts as movement. The ATR is Wilder's smoothing of the true range over Length bars: each value moves one Length-th of the way from the previous value towards the new true range, starting from the simple average of the first window. The first bar has no previous close, so its true range is its high minus its low.
How traders use it#
- Stops: a stop one and a half to two ATR from the entry sits outside the market's ordinary noise.
- Position size: divide the money you risk per trade by the stop distance, and the size follows. The same rule then risks the same money in a wild market and a quiet one.
- Expectations: a move of several ATR in one bar is rare, so a target far beyond one ATR is optimistic.
- Regime: a breakout with a rising ATR has conviction behind it; an ATR at its lowest in months often comes before a larger move, in either direction.
- ATR is the building block of Keltner Channels, SuperTrend and the ATR Trailing Stop.
- Watch out: it has no direction and lags by its smoothing. It is in price units, so compare it only on the same symbol and timeframe, and one huge bar lifts it for weeks.
Settings#
| Setting | Default | What it changes |
|---|---|---|
| Length | 14 | How many bars Wilder's smoothing spans. A shorter length follows the latest bars closely; a longer one gives a steadier value that reacts late. |
| Colours and style | — | The ATR colour; the line's width, dash and visibility under Lines in the Inspector. |
Example on gold#
For example, gold trades near $4,300 and the daily ATR reads about $55. A trader buying a pullback at $4,280 puts the stop one and a half ATR away, near $4,200, and sizes the position so that those $80 are the money they accept to lose. If the ATR climbs to $90 the next week, the same rule says a wider stop and a smaller position, or stand aside until the market calms.
The reading does not say where gold goes; it says how far it may swing on the way. A day that travels three ATR is news, not a normal day. This is an illustration, not a signal.
Add it to your chart#
- Click Indicators in the top strip (on the Pro screen, press I).
- Type
atrand click Average True Range, or press Enter for the first result. - Click its chip in the legend to open the Inspector and change the settings; drag the chip to reorder; the dot hides it; × removes it.
Related#
- Average Day Range — the same idea per day, with how much of an average day today has covered
- Keltner Channels — a moving average with ATR bands around it
- SuperTrend — a trend line a multiple of ATR from the price
- Historical Volatility — volatility in percent per year, comparable across symbols
- Alerts — an alert when the ATR crosses a level
- Adding and tuning indicators