Mass Index
What the Mass Index measures, Dorsey's reversal bulge, its settings on MillionChart and an example on gold.
The Mass Index looks for a coming reversal by watching how the distance between each bar's high and low widens and narrows. It ignores where the price goes: a trend whose bars suddenly grow wider and then settle again is, in its reading, a trend about to turn. Donald Dorsey published it in Technical Analysis of Stocks & Commodities in June 1992.
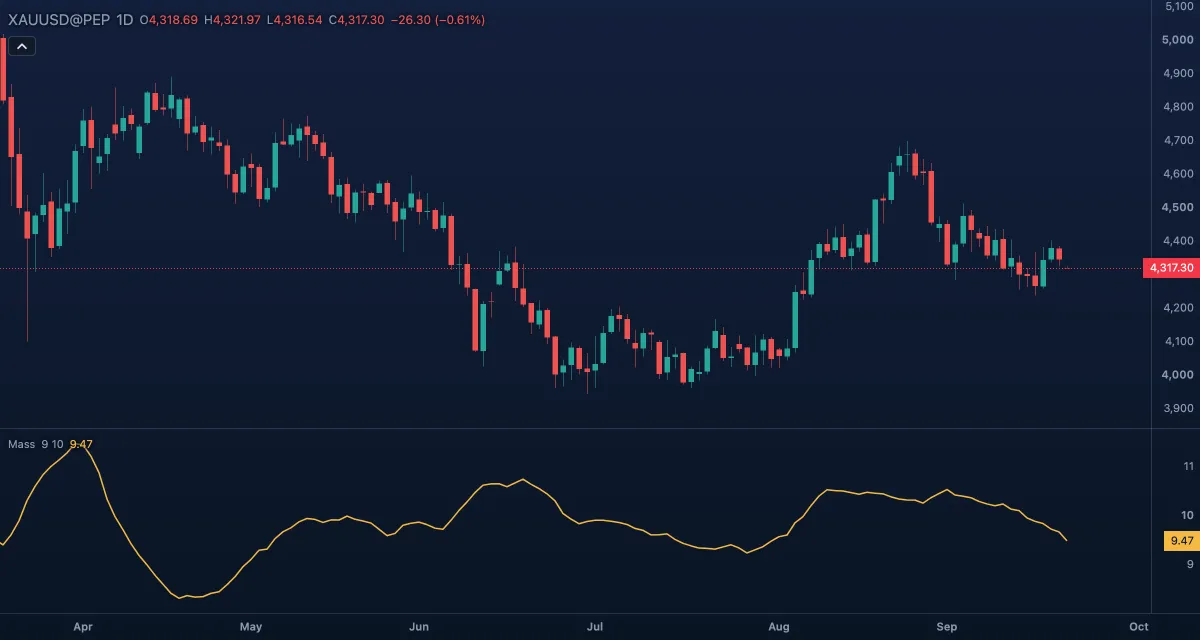
What it shows#
- Mass — one line in its own pane. It hovers around the Sum length (10 by default), because each term of the sum is a ratio close to 1. Rising means the bars are widening compared with the recent past; falling means they are narrowing.
- Bulge (27) and Reversal (26.5) — two dashed levels, hidden by default. They belong to Dorsey's 25-bar sum; with the 10-bar sum the line sits near 10 and never reaches them. Set Sum length to 25 and switch the levels on under Lines in the Inspector to read the index his way.
How it is calculated#
Each bar's range is its high minus its low. A 9-bar exponential average of the range is taken, then a 9-bar exponential average of that average, and the first is divided by the second. The single average reacts to widening bars before the double one does, so the ratio rises above 1 while the ranges grow and falls below 1 while they shrink. The index is the sum of that ratio over Sum length bars. There is no value where the double average is zero.
How traders use it#
- The reversal bulge, with the 25-bar sum: the index rises above 27 and then falls back below 26.5. Dorsey read that as a likely reversal of the trend, whichever way it points.
- Direction comes from elsewhere. Dorsey paired the bulge with a 9-day exponential average of the price: a falling average means expect a turn up, a rising one a turn down.
- With the default 10-bar sum there are no fixed levels; read a peak against the line's own recent peaks, and a drop from it the same way as a bulge.
- It is a volatility measure, so combine it with a trend or momentum tool before acting.
- Watch out: bulges are rare, and in a strong trend they can mark a pause rather than a turn. Two averages and a sum make it slow: it warns rather than times.
Settings#
| Setting | Default | What it changes |
|---|---|---|
| EMA length | 9 | How many bars the two exponential averages of the range span. |
| Sum length | 10 | How many bars the ratio is added over; the line hovers around this number. Dorsey used 25, which the hidden 27 / 26.5 levels belong to. |
| Colours and style | — | The Mass index, Bulge level and Reversal level colours; the line's width, dash and visibility, and the two levels' visibility, under Lines in the Inspector. |
Example on gold#
For example, you set Sum length to 25 and show the two levels. Gold has fallen from $4,500 to $4,250 over six weeks, and in the last fortnight the daily candles have grown wide: big down days followed by big bounces. The index climbs past 27, then slips back under 26.5, a reversal bulge. The 9-day exponential average of the price is falling, so Dorsey's rule says expect a turn up.
A trader does not buy on the bulge alone: they stop adding to shorts and wait for a higher low or a close above a short average, with the stop under $4,250. A new low on still-widening candles says the trend is not done. This is an illustration, not a signal.
Add it to your chart#
- Click Indicators in the top strip (on the Pro screen, press I).
- Type
massand click Mass Index, or press Enter for the first result. - Click its chip in the legend to open the Inspector and change the settings; drag the chip to reorder; the dot hides it; × removes it.
Related#
- Average True Range — the size of the bars as a plain average
- Bollinger BandWidth — another way to see volatility expanding and contracting
- Exponential Moving Average — the 9-day average Dorsey read the bulge with
- Alerts — an alert when the index crosses 27 or 26.5
- Adding and tuning indicators