Smoothed Moving Average (SMMA)
What the smoothed moving average is, how Wilder's smoothing works, its settings on MillionChart and a worked example on gold.
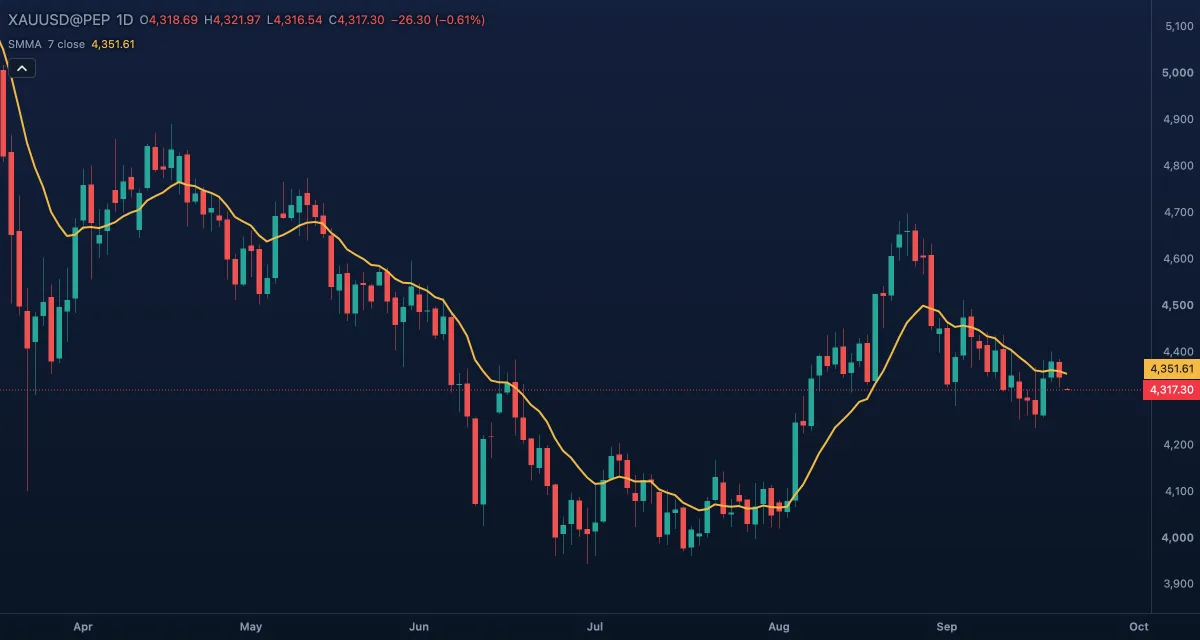
The Smoothed Moving Average is a moving average that moves one N-th of the way towards each new price. It is J. Welles Wilder Jr.'s smoothing from New Concepts in Technical Trading Systems (1978), the same smoothing inside his RSI, ATR and ADX. It reacts more slowly than an EMA of the same length: an SMMA of 7 behaves like an EMA of 13. It is drawn over the candles in price units.
What it shows#
- SMMA — one line over the candles. Rising means the smoothed price is rising; the slope is the trend, the distance from price is how stretched the move is.
- It needs Length bars before its first value, so the line starts a few bars into the history.
How it is calculated#
Each bar: SMMA = (SMMAprev × (N − 1) + price) / N, where N is the Length and price is the Source. The first value is the simple average of the first N bars. Every past bar keeps a share of the line, so it never quite forgets; an EMA with a length of 2N − 1 gives the same weights.
How traders use it#
- As a trend filter: trade long while price closes above a rising SMMA, short while it closes below a falling one.
- As the slow companion of an EMA: a fast EMA crossing above a slow SMMA marks the start of a move, crossing back below marks its end.
- MetaTrader users know it as the Smoothed method of the standard moving average; the Alligator is three SMMAs of the median price.
- A short length (7) hugs the swings; 50 or 200 draws the long trend that pullbacks tend to respect.
- Watch out: it lags more than an EMA of the same number, so it is late at turns and gives back more of a move before it bends. In a range the crossings whipsaw.
Settings#
| Setting | Default | What it changes |
|---|---|---|
| Length | 7 | N in the formula (1 to 5,000). Larger is smoother and slower. |
| Source | Close | The price it averages: Open, High, Low, Close, Mid (HL2), Typical (HLC3) or Average (OHLC4). |
| Colours and style | — | The SMMA line colour. |
Example on gold#
Gold rises from about $4,150 to $4,300 over six weeks. The daily SMMA (7) stays under the candles and bends up slowly. For example, a swing trader uses it as the line in the sand: stay long while the daily close holds above it, and treat the first close under it, say at $4,260, as the cue to tighten the stop rather than to sell at once, because the line lags.
What would invalidate it: two or three daily closes under the line with the line turning down. One close through a slow average is common inside a trend; a turn in the line is not.
Add it to your chart#
- Click Indicators in the top strip (on the Pro screen, I does the same).
- Type
smmaand click the indicator. - Click its chip in the legend to open the Inspector and change the settings; drag the chip to reorder; the dot hides it; × removes it.
Related#
- Exponential Moving Average — the faster cousin; an SMMA of N equals an EMA of 2N − 1
- Simple Moving Average — every bar of the window weighted the same
- Alligator — three SMMAs of the median price, shifted forward
- Average True Range — Wilder's range measure, smoothed the same way
- Adding and tuning indicators