Double Exponential Moving Average (DEMA)
What DEMA is, how it removes part of the EMA's lag, its settings on MillionChart and a worked example on gold.
The Double Exponential Moving Average (DEMA) is an exponential moving average with much of its lag removed: it hugs price more closely than an EMA of the same length and turns sooner. It is one line over the candles, in price units. Patrick Mulloy published it in Technical Analysis of Stocks & Commodities in January 1994.
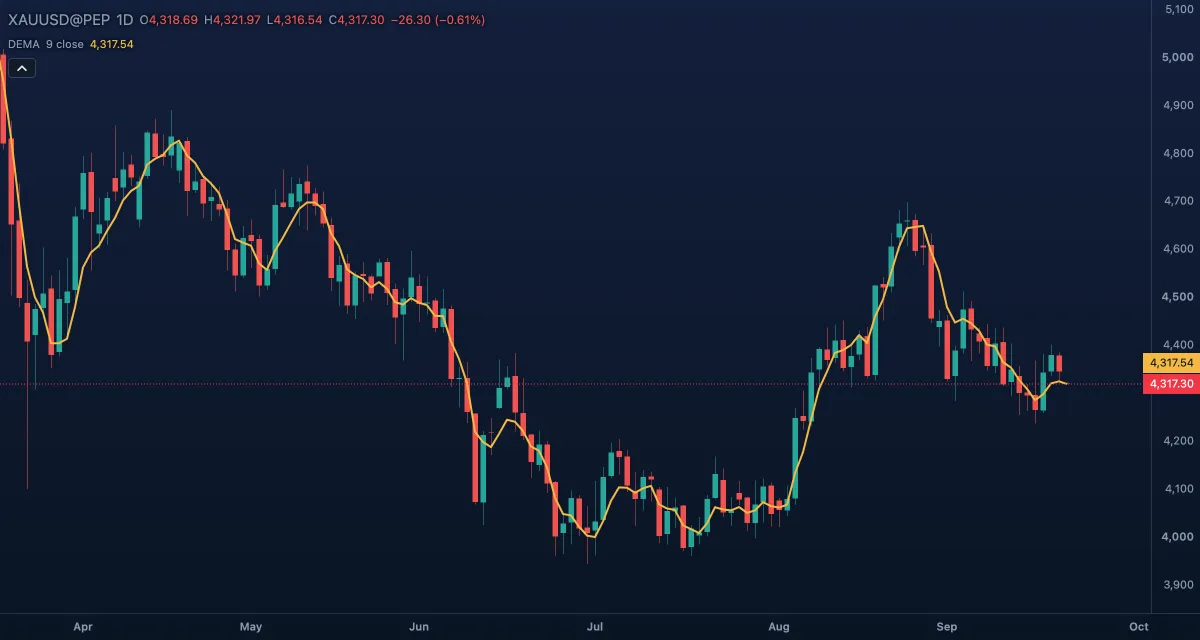
What it shows#
- DEMA — one line over the candles; the legend chip reads
DEMA 9 closeand the current value. - A rising line means the smoothed price is going up; price above the line is read as an upward bias, below it a downward one.
- In a strong move the line can run slightly ahead of where an average "should" be, because the lag correction overshoots; it extrapolates, it does not predict.
How it is calculated#
The engine takes an EMA of the Source over the Length, then an EMA of that EMA with the same length. DEMA = 2 × EMA − EMA of the EMA. The second EMA measures how far the first one lags; subtracting it pushes the line back toward price. Despite the name, the result is not "double smoothed": it is less smooth than a single EMA, and quicker.
How traders use it#
- A faster trend line: the same slope and side-of-price readings as an EMA, earlier, at the cost of more false turns.
- Crosses: a DEMA 9 crossing a DEMA 21, or price crossing a DEMA 20, as an early trend signal, to be confirmed by something slower.
- As a trailing stop on strong moves, where its closeness to price keeps the stop tight.
- Watch out for: speed costs reliability. In a range the DEMA crosses price constantly, and its overshoot after a sharp move can put the line above a fresh high. Use it with a filter that tells a trend from a range.
Settings#
| Setting | Default | What it changes |
|---|---|---|
| Length | 9 | The length of both EMAs, 1 to 5000. The line needs about twice that many candles before its first value. |
| Source | Close | The price smoothed: Open, High, Low, Close, Mid (HL2), Typical (HLC3) or Average (OHLC4). |
| Colours and style | — | The colour, width and dash of the DEMA line. |
Example on gold#
Suppose gold turns up from a low near $4,180 on the daily chart. For example, the DEMA 9 bends upward within two candles and price closes above it at $4,215, while an EMA 9 on the same chart still points down; a trader who wants the earliest trend line takes that as the first sign of a swing up, with the invalidation a close back below the DEMA. Three days later a sharp candle to $4,290 sends the DEMA racing after it. If gold then stalls at $4,280 for a week, the DEMA flattens and price crosses it a few times; those crosses mean little, and that is the moment to lean on a slower average instead.
Add it to your chart#
- Click Indicators in the top strip.
- Type
demaand click the indicator, or press Enter for the first result. - Click its chip in the legend to open the Inspector and change the settings; drag the chip to reorder; the dot hides it; × removes it.
Related#
- Exponential Moving Average — the average DEMA is built from
- Triple Exponential Moving Average — the same trick taken one step further
- Hull Moving Average — another way to cut lag, from weighted averages
- Alerts — an alert when the price crosses the line
- Adding and tuning indicators