Exponential Moving Average (EMA)
What the EMA measures, how it differs from a simple average, its settings on MillionChart and a worked example on gold.
The Exponential Moving Average (EMA) is the average price of the last few candles, weighted so that the newest candles count the most. It is drawn as one line over the candles, in the price's own units, and it follows price more closely than a simple moving average of the same length.
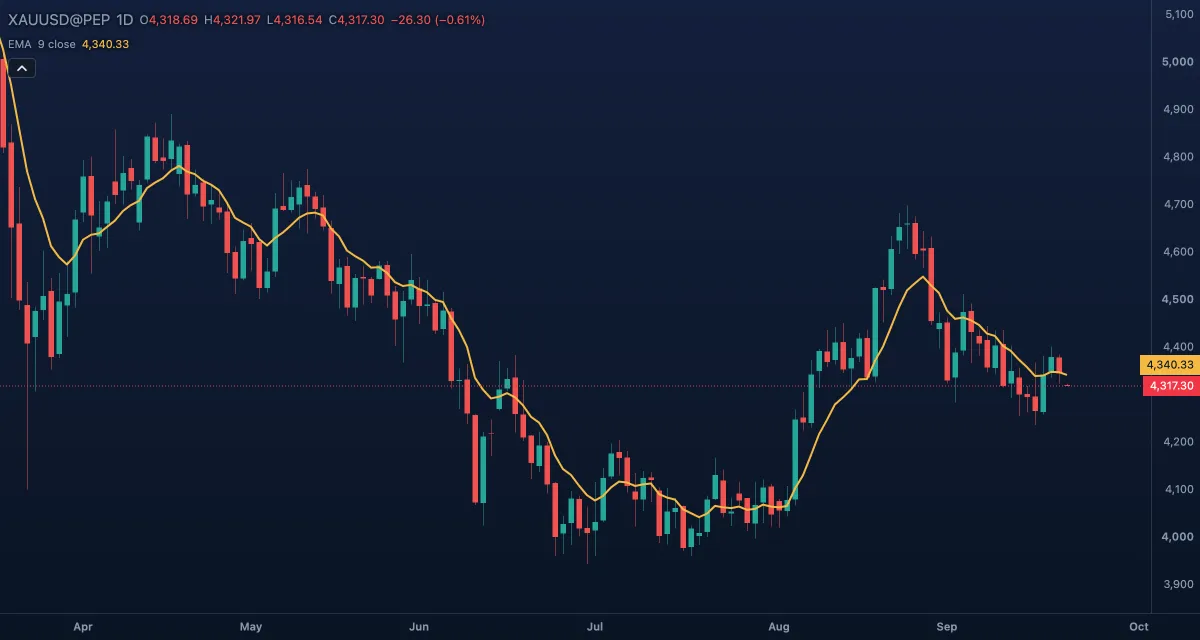
What it shows#
- EMA — one line over the candles. Its chip in the legend reads the short name and the inputs,
EMA 9 close, with the current value next to it. - A rising line means the recent closes are, on average, higher than the earlier ones; a falling line means the opposite.
- Price above the line is read as an upward bias, price below as a downward one.
How it is calculated#
Each candle takes a share of the new close and the rest from the previous EMA: EMA = α × close + (1 − α) × previous EMA, with α = 2 / (length + 1). With the default length of 9, α is 0.2, so each new close moves the line a fifth of the way toward it. The first value is the simple average of the first 9 closes. The Source input chooses which price goes in (the close by default).
How traders use it#
- As a trend filter: trade in the direction of the line's slope, or only long while price closes above it.
- Two EMAs: a short one crossing above a longer one (9 over 21, for example) is read as the start of an upswing, a cross below as its end. Crosses come late by design.
- As moving support or resistance: in a trend, pullbacks often pause near the 20- or 50-period EMA.
- A wide gap between price and its EMA means a stretched move, not a reversal signal by itself.
- Watch out for: in a sideways market the line flattens and price crosses it again and again. Every moving average lags; it confirms a move, it does not predict one.
Settings#
| Setting | Default | What it changes |
|---|---|---|
| Length | 9 | How many candles the average weighs, 1 to 5000. Shorter follows price closely and turns often; longer is smoother and later. |
| Source | Close | The price fed into the average: Open, High, Low, Close, Mid (HL2), Typical (HLC3) or Average (OHLC4). |
| Colours and style | — | The colour of the EMA line, its width and dash. |
Example on gold#
Suppose gold on the daily chart has climbed from $4,100 to $4,350 over six weeks, and the 9-period EMA has stayed under the candles the whole way. For example, a dip to $4,290 that closes back above the EMA is the kind of pullback trend traders look to buy, with the invalidation a daily close below the line. If instead gold closes under the EMA and the line turns down, the short-term trend is in question and a long entry has lost its reason. The line does not say how far a move will go, only which side of the recent average price is on.
Add it to your chart#
- Click Indicators in the top strip.
- Type
emaand click the indicator, or press Enter for the first result.ema 21adds a 21-period EMA at once. - Click its chip in the legend to open the Inspector and change the settings; drag the chip to reorder; the dot hides it; × removes it.
Related#
- Simple Moving Average — the same idea with equal weights; slower and smoother
- MA Cross — two averages with a mark where they cross
- Alerts — an alert when the price crosses the line
- Adding and tuning indicators