Keltner Channels (KC)
What Keltner Channels draw, the ATR form and Keltner's 1960 rule, their settings on MillionChart and an example on gold.
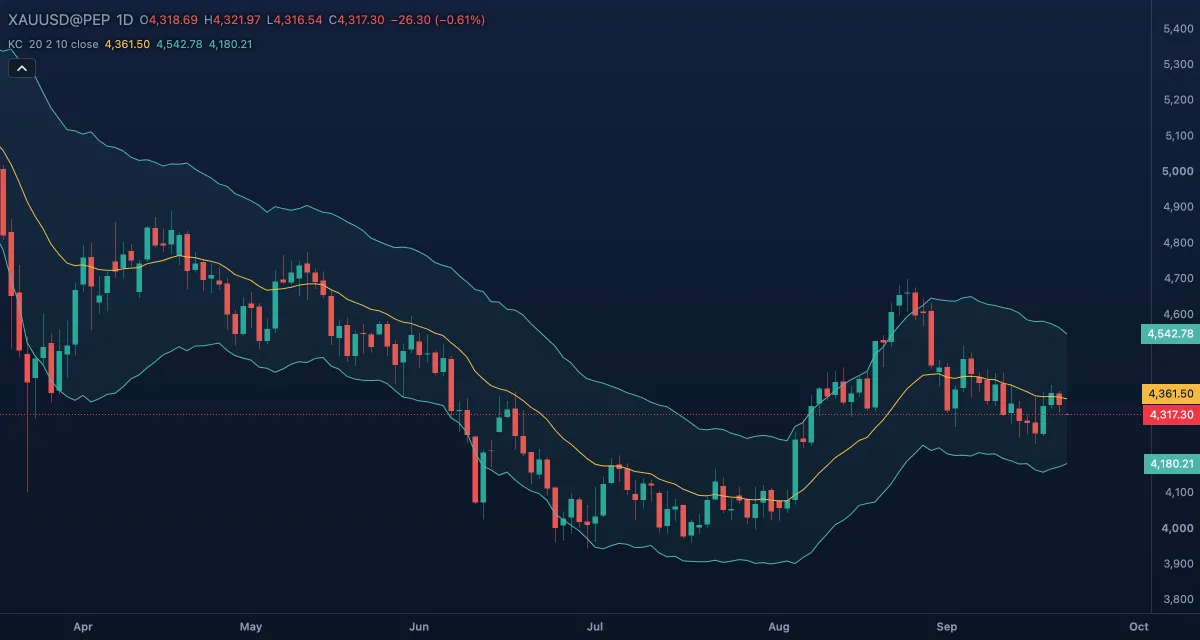
Keltner Channels draw an exponential moving average with a band on each side a multiple of the Average True Range away, so the channel's width follows the size of the market's own bars. The lines are in price units and sit over the candles. Chester W. Keltner published the original rule in 1960; the ATR form used today was popularised by Linda Bradford Raschke, and the chart offers both.
What it shows#
- Basis — the 20-bar exponential moving average of the source; its slope is the trend.
- Upper and Lower — the basis plus and minus two times the 10-bar ATR. Near a band the price is far from its average by the market's own measure of a normal move.
- Channel fill — the tint between the bands, wider when the bars are bigger.
- With Method set to Keltner 1960 the lines follow his original rule: a 10-bar simple average of the typical price, with a band one 10-bar average of the high–low range on each side. That channel is narrower, and the price touches it often.
How it is calculated#
In the default method the basis is the exponential average of the Source over EMA length, or a simple average when Use exponential MA is off. The band distance is ATR multiplier times a range chosen by Bands style: Wilder's ATR over ATR length (the default), the bar's own true range without smoothing, or Wilder's average of the high minus the low over the EMA length. In the 1960 method the basis is the simple average of (high + low + close) / 3 over Length (1960 rule), and the band is the simple average of the high minus the low over the same bars.
How traders use it#
- Trend: a price riding the upper band shows strength; a pullback to the basis that holds is the usual entry with the trend.
- Breakout: closes outside the channel are rarer than touches of Bollinger Bands, because ATR bands move more steadily, so a close outside is read as a real push.
- The squeeze: when the Bollinger Bands fit inside the Keltner Channels the market is compressed; the first close outside the Keltner band after that is the breakout. Squeeze Momentum marks those bars.
- In a sideways market the bands mark the edges of a normal swing and the basis is the target of the move back.
- Watch out: both the average and the ATR lag, a band touch in a strong trend is not a reversal, and the 1960 form gives many touches that mean little on their own.
Settings#
| Setting | Default | What it changes |
|---|---|---|
| Method | EMA and ATR | EMA and ATR uses the next six settings; Keltner 1960 uses only Length (1960 rule). |
| EMA length | 20 | How many bars the basis averages. |
| ATR multiplier | 2 | How many ranges the bands sit from the basis (0.1 to 50). |
| Bands style | Average True Range | The range the bands are built from: Average True Range, True Range (the bar's own, unsmoothed) or Range (high minus low, smoothed over the EMA length). |
| ATR length | 10 | How many bars the ATR spans, for the Average True Range style. |
| Use exponential MA | On | Off makes the basis a simple moving average. |
| Source | Close | The price the basis averages: Open, High, Low, Close, Mid, Typical or Average. |
| Length (1960 rule) | 10 | The bars of both averages in Keltner's original rule. |
| Colours and style | — | The Basis, Upper band, Lower band and Channel fill colours; each line's width, dash and visibility under Lines in the Inspector. |
Example on gold#
For example, gold is in an uptrend near $4,300 and the 10-day ATR is about $50, so the channel is about $200 tall: basis $4,250, upper band $4,350, lower band $4,150. The price pulls back from the upper band to the basis and prints a daily candle that closes back above it. A trend trader reads that as the pullback ending and buys, with the stop under the lower band near $4,150 and the upper band as the first target.
A daily close under the lower band would say the uptrend is over rather than pausing. This is an illustration, not a signal.
Add it to your chart#
- Click Indicators in the top strip (on the Pro screen, press I).
- Type
keltnerand click Keltner Channels, or press Enter for the first result. - Click its chip in the legend to open the Inspector and change the settings; drag the chip to reorder; the dot hides it; × removes it.
Related#
- Average True Range — the range the bands are built from
- Bollinger Bands — bands from the standard deviation; inside the Keltner Channels they mark a squeeze
- Squeeze Momentum — the squeeze setup as its own indicator
- Moving Average Envelopes — bands a fixed percentage from the average instead of an ATR multiple
- Alerts — an alert when the price crosses a band
- Adding and tuning indicators