Coppock Curve
What the Coppock Curve measures, the turn from below zero it was designed for, its settings on MillionChart and an example on gold.
The Coppock Curve is a long-term momentum line: the sum of two rates of change of the price, smoothed with a weighted average. It is measured in percent and has no fixed range. Edwin Coppock published it in Barron's in 1962 for monthly charts of a stock index, to mark the start of a long rise; the chart applies the same lengths to whatever timeframe you are on.
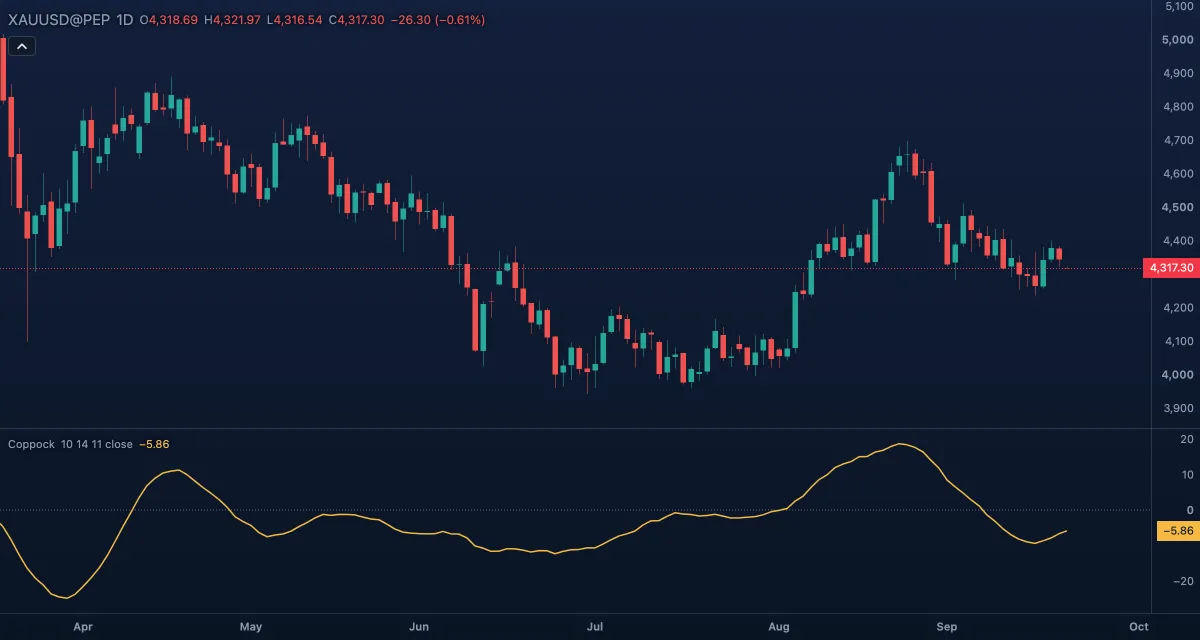
What it shows#
- Coppock — one line in its own pane. Above zero the price is higher than it was 11 and 14 bars ago, taken together; below zero, lower. Rising means momentum is improving.
- Zero — a dotted line at zero. There are no overbought or oversold levels; the reading is about the turn, not the height.
How it is calculated#
The chart takes the rate of change of the Source over Long ROC length bars and over Short ROC length bars — each in percent: 100 × (price / price n bars ago − 1) — and adds the two. The sum is then smoothed with a weighted moving average over WMA length bars, which gives the newest bars the most weight.
How traders use it#
- The original reading: the curve turning up from below zero — making a trough under zero and rising — is a buy for a long-term position. Coppock gave no sell rule; he meant it for buying after a bear market.
- Many traders also read the zero cross: rising through zero as the start of an uptrend, falling through it as the end.
- On monthly bars the signals are rare and slow, which was the point. On daily or intraday bars the same lengths cover days or hours, so the curve behaves like any other momentum oscillator. Switch the timeframe to weekly or monthly for the classic use.
- Divergence between the price and the curve, as with other oscillators, warns a trend is tiring.
- Watch out: the smoothing adds lag, so the turn is confirmed well after the low; and in a flat market the curve hovers near zero and crosses it with no trend to follow.
Settings#
| Setting | Default | What it changes |
|---|---|---|
| WMA length | 10 | Bars of the weighted average that smooths the sum. Longer is slower and smoother. |
| Long ROC length | 14 | Bars of the longer rate of change. |
| Short ROC length | 11 | Bars of the shorter rate of change. Coppock's 14, 11 and 10 are the defaults. |
| Source | Close | Which price is measured: Open, High, Low, Close, Mid (HL2), Typical (HLC3) or Average (OHLC4). |
| Colours and style | — | The colours of the Coppock line and the Zero line; width and dash under Look in the Inspector. |
Example on gold#
On a weekly chart of gold, for example, the price has fallen from $4,600 to $4,100 over several months and the Coppock Curve has been below zero the whole way. The price steadies around $4,150 and the curve makes a trough and turns up while still under zero. That is the reading Coppock designed: a long-term buyer takes the position here, well before the curve crosses zero, with a stop under the low of the base.
What would invalidate it: the curve turning down again below zero with a weekly close under $4,100 — the trough was a pause in the decline, not its end.
Add it to your chart#
- Click Indicators in the top strip (on the Pro screen, press I).
- Type
coppockand click the indicator, or press Enter for the first result. - Click its chip in the legend to open the Inspector and change the settings; drag the chip to reorder; the dot hides it; × removes it.
Related#
- Rate of Change — the building block of the curve
- Know Sure Thing — Martin Pring's sum of four smoothed rates of change
- MACD — another unbounded momentum line, built from averages
- Alerts — an alert when the curve crosses zero
- Adding and tuning indicators